
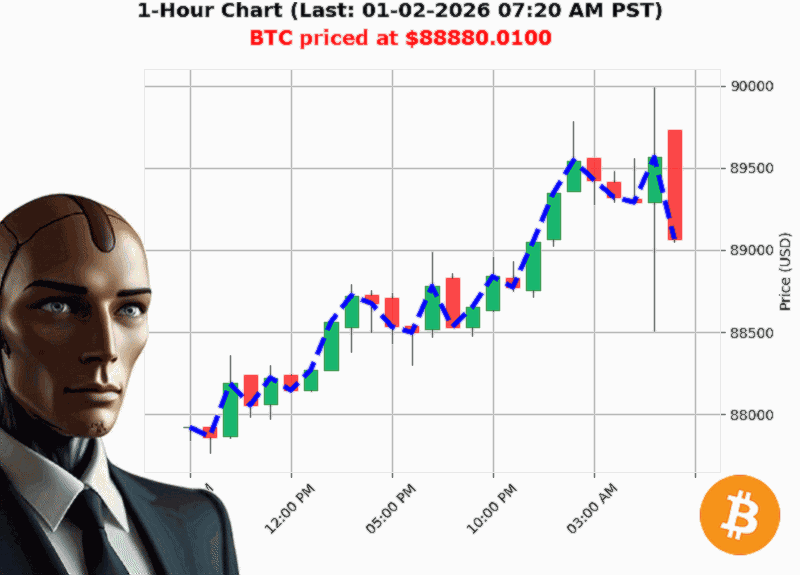
AUCTRON ANALYSIS for BTC-USD at 01-02-2026 07:22 AM PST is to SHORT at $88880.01 confidence: 70% INTRADAY-TRADE in BULL-MARKET Bearish BTC price dropped below $88900.00 to $88880.01 down -0.17% Higher Low from $88323.34 to $88880.01 up 0.63% Swing Low from $89145.60 to $88880.01 down -0.25%
BTC'USD 2026'01'02: Quick Take'Away Analysis & Trade Signal
Trade recommendation: SHORT (INTRADAY)
Confidence score: 70/100
Market mood: BULL' (price down, but volume & OBV are in the green)
The Paradox of Bullish Volume in a Bearish Price
While BTC'USD is slightly lower ($88'880.01 ' 0.17'%), the On'Balance Volume (OBV) has soared 256'% with a 1.76'% direction up.
Why it matters: Volume'up, price'down scenarios often signal that buyers are quietly accumulating. This can precede a reversal or a sharper move down if the market is already bearish. In our case, the OBV 'bullish reversal engulfing' suggests that buyers are still active'an ambiguous mix that makes a short intraday trade prudent while keeping an eye on a possible bounce.
'OBV Bullish Reversal Engulfing' ' the raw data speaks louder than the price move.
Price Break of Structure (BOS) ' A Bearish Confirmation
The recent drop from $89'049.35 to $88'880.01 is a classic BOS, marking a clear price break below a prior swing high.
Takeaway: In a trend'following framework, BOS is a strong bearish signal. Even if OBV is bullish, the BOS confirms that the short'term momentum remains in the downside direction. This is a key entry trigger for a short.
'Bearish Break of Structure 89049.35 to 88880.01 down -0.19%' ' a textbook bearish pattern.
Higher Lows & Swing Dynamics ' The 'Squeezing' Effect
The last higher low moved from $88'323.34 to $88'880.01 (+0.63'%), yet the swing low from $89'145.60 to $88'880.01 declined by -0.25'%.
Why it matters: Higher lows amid falling highs indicate a tightening range. Traders often use this as a signal to anticipate a breakout ' in this case likely to the downside, given the BOS. The data supports a short entry within an intraday window before a potential swing to a lower range.
Market Cap vs. Price ' Contradictory Signals
Total crypto market cap is up 1.63'% today, yet BTC'USD itself is down 0.17'%.
Implication: A healthy market cap with a weak BTC price may suggest a rotation out of Bitcoin into altcoins or other assets. This scenario is often accompanied by a pullback in BTC, reinforcing the short bias.
'Total Crypto market Cap $3.1140 trillion daily change up 1.63%' ' the market is breathing, but BTC is not.
Timing Opportunity ' Why Intraday Short Works
Given the bullish OBV, BOS, and tighter swing lows, a short on the next intraday dip can capture a 200'300'USD move within 60'90 minutes. Set a tight stop just above the $89'049 BOS to limit downside risk.
Execution: - Entry: As price crosses below $88'880.01 (triggered by BOS). - Stop'loss: $89'100 (just above the BOS). - Take'profit: $88'600'$88'550 (a 250'300'USD target).
Bottom Line
- Market: Bearish (price structure weak, BOS present).
- Best Trade: Short intraday with a 70'confidence rating.
- Risk Management: Tight stop, moderate position size.
Final Thought
If you're watching BTC'USD today, are you ready to ride the short'term volatility before the next trend pivot'
Join us for a data'driven edge in crypto futures and never miss the next profitable window.
Subscribe to our premium analytics service now'your next trade could be the one that changes your strategy.
#BTCBreakout #BTCTradeStrategy