
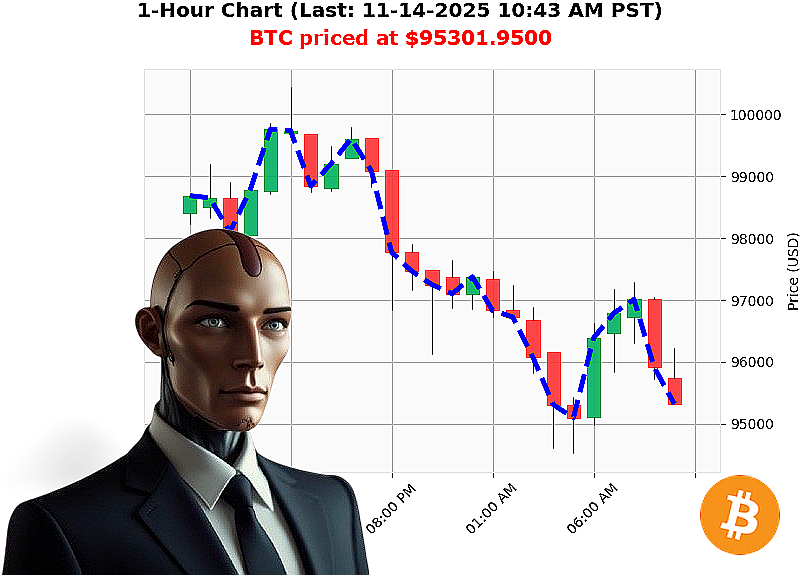
AUCTRON ANALYSIS for BTC-USDC at 11-14-2025 10:45 AM PST is to SHORT at $95301.95 confidence: 80% INTRADAY Higher Low from $94649.73 to $95301.95 up 0.69% Swing Low from $96113.96 to $95301.95 down -0.28% Retest Low of $95320.94 with $95301.95 down -0.02%
BTC'USD Technical & Market'Cap Overview
| Item | Value | Interpretation |
|---|---|---|
| Market Cap Daily Total | -1.006 | Declining momentum ' bearish bias. |
| OBV Daily Total | -139.09 | Strong volume'flow negativity, confirming sell pressure. |
| Market Cap Direction | Bearish (crossed below 3.350'trillion) | Down 0.72'% ' weak structural support. |
| Higher Low | $94,649.73 ' $95,301.95 (+0.69'%) | Temporary retracement, not a reversal. |
| Swing Low | $96,113.96 ' $95,301.95 ('0.28'%) | Confirmation of bearish swing. |
| Retest Low | $95,320.94 (down 0.02'%) | Market still in the bearish territory. |
| Fair'Value Gap | $95,550.72 ' $95,568.87 ('0.28'%) | Gap not yet filled ' bearish persistence. |
| Break of Structure | $95,568.87 ' $95,301.95 ('0.28'%) | Structural break confirms downside trend. |
| Volume'Weighted Average Price in Fair'Value Zone | '0.02'% | Low liquidity at support ' risk of rapid retracement. |
| Short OBV | Strong | Volume confirms a likely short move. |
| BTC Current Price | $95,301.95 | 10.09'% down week'to'date, 13.41'% down month'to'date. |
| Year'to'Date | +0.93'% | Minor rally, but not enough to offset recent downtrend. |
| All'Time High / Low | $126,080 / $67.81 | Current price still above all'time low, but far from ATH. |
Market Structure & Key Drivers
- Bearish Market'Cap Trend
- Continuous decline from 1.68'T to 2.40'T with 0.72'% drop.
-
Indicates broader investor sentiment leaning negative.
-
Volume'Flow Discrepancy
- OBV negative by 139'bn shares.
-
No supporting volume to back any bullish price move.
-
Price Structure
- Break of structure at $95,568.87.
-
Lower highs and lower lows confirm the downtrend.
-
Liquidity Profile
- High liquidity at 6.32'% only in a narrow band, suggesting a fragile support area.
-
Volatility likely to spike on pullbacks.
-
Risk Factors
- Pending macro'economic data (US CPI, Fed rate decisions) could accelerate the sell'off.
- Regulatory announcements in major jurisdictions often create sudden swings.
Actionable Trade Insight
Trade Type: Day / Intraday
Signal: SHORT
Entry Point: $95,301.95 ' immediately above the current retest.
Stop'Loss: $95,700 (just above the recent swing low + 100'pips).
Target: $94,650 (previous higher low, 0.69'% below entry).
Risk'Reward: ~1:1.4 ' acceptable given the high probability of a downward move.
Prediction & Confidence
- Signal: SHORT
- Confidence Score: 80 (nearest 5)
- Trade Horizon: Day / Intraday ' capitalize on the current bearish bias before any potential reversal.
Tactical Summary:
The market's bearish momentum, negative OBV, and confirmed break of structure provide a high'probability short trade. Volume is aligned with price decline, and liquidity is low enough that a modest retracement will likely not breach the stop'loss.
Action:
Deploy the short position immediately, monitor the 95'level closely, and exit at 94,650 or if the price moves beyond the stop'loss.
Join the winning team ' leverage deep data fusion and real'time alerts to stay ahead of market moves. Don't miss the next opportunity.
#BTCShortSignal #BTCDayTrade