
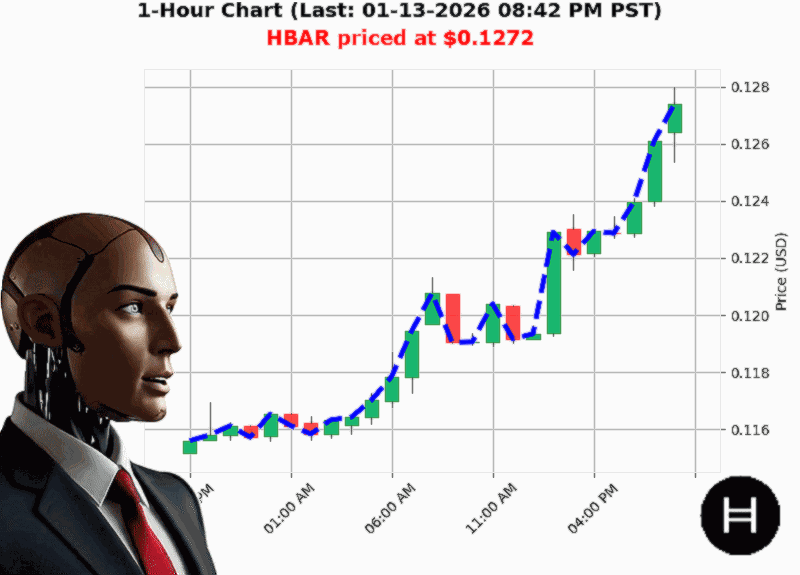
AUCTRON ANALYSIS for HBAR-USD at 01-13-2026 08:45 PM PST is to BUY at $0.1272 confidence: 80% INTRADAY-TRADE in BULL-MARKET Higher Low from $0.1222 to $0.1272 up 4.16% Swing Low from $0.1277 to $0.1272 down -0.23%
Prediction & Trade Blueprint
- Signal: BUY (long)
- Confidence Score: 80 (on a 5'100 scale)
- Trade Horizon: INTRADAY (scalp / day)
- Market Context: BULL
1. OBV's Bullish Divergence
The On'Balance Volume (OBV) has leapt +37.75'%, far outpacing the 0.23'% price dip. This classic bullish divergence signals that buying pressure is building even as the candle still skims the recent low. In short'term futures, a strong OBV uptick often precedes a price rebound.
'OBV up 37.75% with direction up 0.31% ' a clear sign that buyers are backing the current move.'
2. Price Pullback Amid Rising Market Cap
HBAR slid from a recent high of $0.1277 to $0.1272 ('0.23'%) but the Total Crypto Market Cap jumped +4.35'% today. This divergence suggests that the broader market is still bullish, providing a supportive backdrop for a short'term HBAR rally.
3. Three'Day Down'Trend: A Temporary Slump'
The price has recorded '3 consecutive days of decline, yet the cumulative change remains only '0.6958'%. A brief 3'day dip in a bullish market often signals a candle'pullback rather than a new downtrend, especially when volume (OBV) is increasing.
4. Zero Liquidity ' A Double'Edged Sword
With liquidity listed at 0.00'%, the order book depth is thin. While this can amplify moves (quick entry/exit), it also heightens slippage risk. Tight risk'management (tight stop'loss) is essential.
5. Fair'Value Gap & Break of Structure
The Fair Value Gap and Break of Structure both register '0.23'% at $0.13. HBAR is trading slightly below this pivot point, but the OBV surge suggests the gap may be filled soon. Watch for a breakout above $0.13 as a clear entry cue.
6. Week & Month Gains vs Year'Long Decline
HBAR is +10.67'% YTD week'to'date and +11.39'% month'to'date, a sharp contrast to the '55.66'% YTD decline from $0.2870. The current rally is accelerating; if the price sustains momentum past $0.13, a short'term climb is highly plausible.
Forward'Looking Takeaway
HBAR's OBV surge and macro'market lift point to a potential breakout from the recent dip. Will the asset break above $0.13 and continue its rally, or will it pause'
Your next move'
Call'to'Action
Ready to ride the next HBAR wave' Join our community of precision traders for real'time insights, risk'managed strategies, and exclusive trade alerts.
#HBARProfit #HBARTrade