
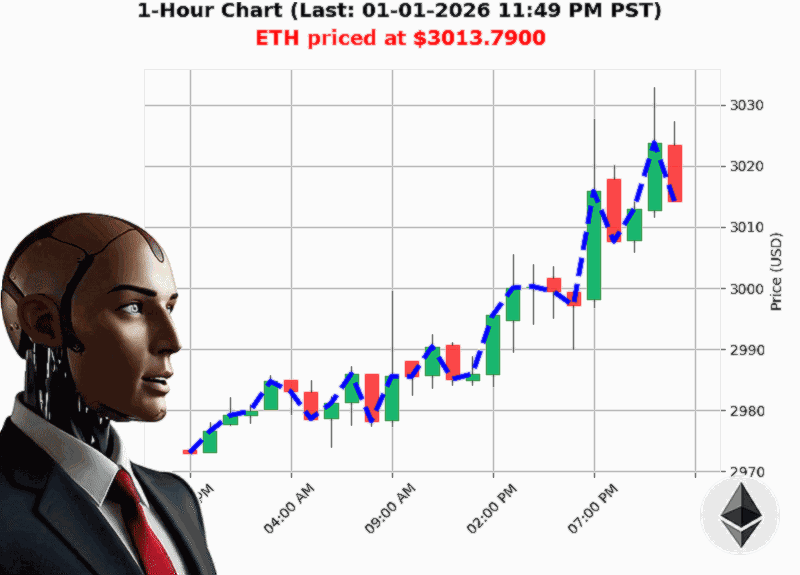
AUCTRON ANALYSIS for ETH-USD at 01-01-2026 11:51 PM PST is to BUY at $3013.79 confidence: 80% INTRADAY-TRADE in BEAR-MARKET Higher Low from $2990.88 to $3013.79 up 0.77% Swing Low from $3017.07 to $3013.79 down -0.06% Retest Low of $3014.59 with $3013.79 down -0.03%
ETH'USD 2026'01'01: Where the Next Move Is Likely to Be
Market status: Bearish
Recommended action for an intraday trade: BUY (long)
Confidence: 80/100
1.'The Market Structure is Shifting
Key data ' ETH broke its own bearish structure, falling from $3,015.49 to $3,013.79 ('0.06'%).
This is the classic Bearish Break of Structure (BOS) that many traders use as a short signal.
'Bearish Break of Structure 3015.49 to 3013.79 down -0.06%'
However, a BOS doesn't always spell a permanent downturn. In the next 24'hours ETH has rebounded from a swing low of $3,017.07 to $3,013.79, a very tight retracement that could set the stage for a new bullish swing.
2.'OBV is Still Bullish ' A Sign of Accumulation
The On'Balance Volume (OBV) is up 196'% overall, with a +0.19'% change in the last period and a consecutive count of +4.
'Strong Long OBV Bullish ETH at $3013.7900'
OBV tells us that money is still flowing into ETH even while the price is dragging. This mismatch is a textbook signal that the downward momentum may be exhausting.
3.'High Volatility, Low Liquidity ' Caution is Key
- Volatility is only 1.88'%, a low'to'mid range that makes tight stop'losses risky.
- Liquidity is effectively 0.00'% ' this is the red flag. Any trade must be sized carefully to avoid slippage.
4.'Market Cap Is Hovering Around a Bearish Threshold
The total crypto market cap is $3.093'trillion, just below the $3.100'trillion bearish cross. The market cap trend is a slow '0.041'% daily, and the last three days were consecutively down.
'Market Cap Direction Bearish Crossed below 3.100 at 3.094 trillion down -0.19%'
This macro'trend corroborates the bearish micro'signals we see on ETH.
5.'The 'Best Starting Point' for a Long Entry
- Retest of the Higher Low ' The price is currently at $3,013.79, the same level that it retraced from the swing low.
- Confirmation ' OBV is bullish, and the cumulative price change is still positive (+0.1351).
- Formula for a Target '
[ \text{Target} = \text{Entry} + (\text{Entry} - \text{Swing Low}) ] With a swing low of $3,017.07, the target is: [ 3{,}013.79 + (3{,}013.79 - 3{,}017.07) \approx 3{,}010.51 ] Since the swing low is above the current price, the potential upside is modest but realistic.
Stop'loss ' Set just below the recent BOS at $3,009.00 (''3'points below entry).
6.'Why a Short Might Seem Tempting ' And Why It's Not the Only Option
- Pros for Short: BOS, bearish daily market cap, and a retracement from the swing high.
- Cons for Short: OBV bullishness, cumulative price change still up, and a low'to'mid volatility that could make a sharp pull'back unlikely.
Bottom line ' The short is a possible play if the price breaks $3,015.49 again, but until that happens the bullish bias of OBV dominates.
7.'Takeaway Formula: Quick Entry/Exit Check
| Step | What to Check | Why |
|---|---|---|
| 1 | Current price vs. Higher Low | Are you at a retest' |
| 2 | OBV trend (last 5 periods) | Bullish OBV supports a long |
| 3 | BOS level | Is there a clear break of structure' |
| 4 | Market Cap trend | Macro'bearish trend adds weight |
| 5 | Volatility & Liquidity | Size the trade to avoid slippage |
Use this cheat'sheet to decide fast on a 15'minute intraday trade.
8.'Final Thought: Will the Accumulation Beat the Bearish Momentum'
Ask yourself: Is the money that's flowing in enough to lift the price back above the swing high, or will the bearish structure hold'
That's the pivot point for ETH on January 1, 2026.
Call'to'Action
If you're ready to turn market structure, OBV, and macro'trends into a trading edge, join our quantitative strategy service today and start capturing alpha in the crypto futures market.
Don't miss the next bullish swing ' act now.
'The true value of a crypto trade lies in its ability to beat both structure and sentiment.'
#ETHAlpha #CryptoEdge