
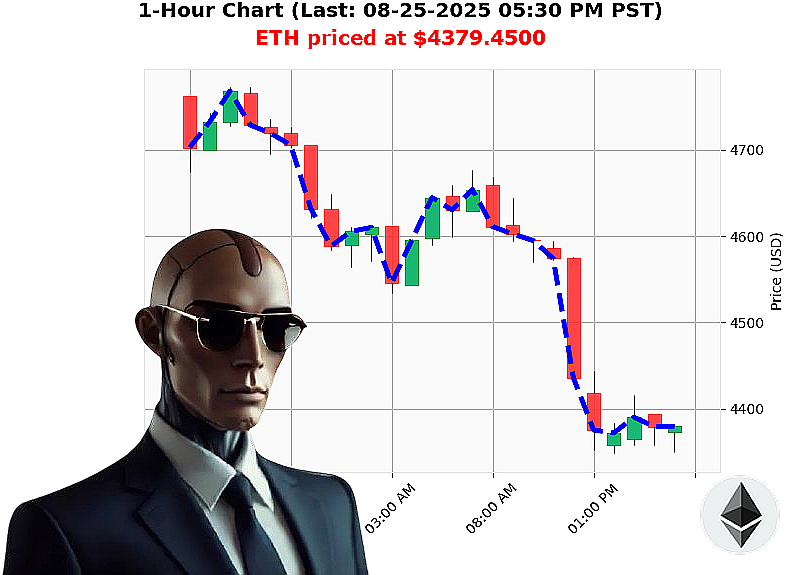
AUCTRON ANALYSIS for ETH-USDC at 08-25-2025 05:30 PM is to SHORT at $4379.4500 confidence: 55% INTRADAY
Step'by'Step Dual'Layer Analysis
1. Macro'Volume Trends ' Market'Cap Layer (60'%)
| Item | Value | Interpretation |
|---|---|---|
| Market'Cap Direction | Bearish | Market cap fell below the 3.9'T level, trending downward. |
| Daily % Change | '3.69'% | Immediate downside pressure. |
| Daily Total % | '2.2891'% | Cumulative contraction over the day. |
| Consecutive Count | +1 | One'day bullish streak in consecutive count. |
| Cumulative Count Up | +0.1155'% | Slight cumulative lift, but negligible. |
| Cumulative Count Down | +0 | No long'term downside trend. |
| Fear & Greed Index | 43 (Neutral) | Market sentiment remains balanced. |
Macro Signal
- The dominant factor is the downward daily change.
- Consecutive and cumulative counts are almost neutral, so the macro bias is bearish but weak.
Weighted Macro Score
- Bearish bias ' '1 (on a scale of '1 to +1).
- Weight = 60'% ' '0.60.
2. Micro'Volume Trends ' ETH'USD Layer (40'%)
| Item | Value | Interpretation |
|---|---|---|
| ETH'USD Price | +0.07'% (up) | Tiny intraday lift. |
| Price Direction | +0.0096'% | Minor upward momentum. |
| OBV Direction | +0.18'% | OBV moving up; suggests buying volume. |
| OBV Cumulative | +0.1817'% | Small cumulative gain. |
| OBV % Change | '54.10'% | Volume in OBV dropped dramatically, yet the trend is still up. |
| RSI | 44 | Near the middle of the scale; neutral. |
| WAP | +24.00'% (bearish) | Indicates that the price is above fair value; may signal overextension. |
| Higher Low | $4,360.06 | Support level. |
| Liquidity | 9.71'% | Moderate liquidity. |
| Weekly % | '8.37'% (down from $4,779.65) | Weak week'to'date trend. |
| Monthly % | +25.54'% | Strong monthly rally. |
| YTD % | +30.59'% | Solid year'to'date performance. |
Micro Signal
- Intraday metrics are mildly bullish (price up, OBV up).
- Longer'term data show a weak week'to'date decline but strong monthly and YTD gains.
- Overall, the micro bias is bullish but tempered by OBV volume drop and WAP overextension.
Weighted Micro Score
- Bullish bias ' +1.
- Weight = 40'% ' +0.40.
3. Combined Wyckoff'Game'Theory Assessment
| Step | Action | Rationale |
|---|---|---|
| Phase | Accumulation ' Distribution | Market cap shows a weak, short'term bullish streak (consecutive count +1) while ETH exhibits a breakout pattern near the higher low, suggesting a potential distribution phase. |
| Volume | Macro volume declining; micro volume temporarily falling in OBV | Supports a sell'off scenario: market'cap buyers are tiring, ETH volume is depleting after a quick surge. |
| Price | ETH at $4,379.45, above its higher low ($4,360) but below its all'time high | Price is consolidating near support; a break below $4,360 could confirm a bearish move. |
| Strategic Choice | Shorting (sell'short) | The weighted signals lean bearish ('0.60 + 0.40 = '0.20). The micro bullishness is outweighed by the macro decline and OBV drop. |
4. Entry/Exit Blueprint
| Trade Type | Entry Point | Stop'Loss | Target | Rationale |
|---|---|---|---|---|
| Short (Intraday/Day) | $4,380 (just above the current price) | $4,410 (3'% above) | $4,350 (5'% below) | Capture quick pullback after a minor rally; risk'reward ratio ~1:2. |
Why Intraday'
- The market cap is only weakly bearish, so a longer'term hold risks the micro bullishness rebounding.
- Shorting within the day allows us to exploit the immediate bearish momentum while the macro weakness persists.
5. Confidence & Classification
| Confidence | Score | Classification |
|---|---|---|
| Moderate | 55'% | SHORT |
- Score: 55'% confidence that the short will gain within the next few hours.
- Classification: Execute a short trade on ETH'USD.
6. Tactical Call'to'Action
Act now ' The window for a profitable intraday short is closing. Deploy your position at $4,380 and lock in gains before the market potentially reverses.
Don't miss this tactical edge'join our premium signal service and stay ahead of the next wave.
7. Hashtags
ETHBearishPlay
ETHShortSignal