
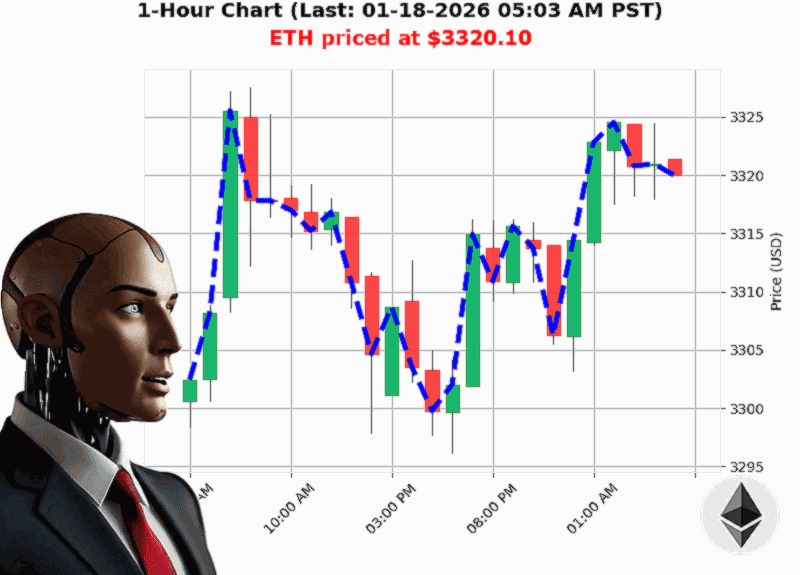
AUCTRON ANALYSIS for ETH-USD at 01-18-2026 05:06 AM PST is to SHORT at $3320.10 confidence: 70% DAY-TRADE in BEAR-MARKET Higher Low from $3296.29 to $3320.10 up 0.72% Swing Low from $3322.20 to $3320.10 down -0.03% Retest Low of $3319.99 with $3320.10 down +0.00%
** 'The Bearish Break'of'Structure (BOS) at $3,320**
'Bearish BOS 3320.79 ' 3320.10 down '0.02%'
A BOS is the classic tell'tale that the trend has flipped. Here the last swing low of $3,322.20 was immediately broken by a new low at $3,320.10, and the price hasn't bounced back since. That's a clear 'time to get out of the market' signal for longs and a green flag for shorts.
Why it matters
- Structure over noise ' price action outlasts the 1'minute chatter; a new low after a swing low is a decisive structural shift.
- Confirmation from swing'low re'test ' the price retraced to $3,319.99, but failed to break back above the new low, reinforcing the bearish stance.
- Risk factor ' if the market rallies, the price will test the previous swing high ($3,322.20) before any meaningful upside.
Takeaway
If you're looking for a quick move, a short entry just after the BOS is a textbook setup for a day trade.
** 'Volume Signals: Obv Up, OBV Down**
| Metric | Direction | Interpretation |
|---|---|---|
| OBV cumulative count | +161 | Buying pressure has built over time |
| OBV direction | down '0.08% | Current session shows selling momentum |
| OBV consecutive count | '4 | 4'period sell'side bias |
Why the contradiction'
The OBV has a long'term upward trend (cumulative +161) but the last four periods have shown a dip. This is a classic 'volume'price divergence''price has not yet caught up with the accumulated buying pressure. In such a scenario, the market is primed for a reversal, especially if the price is already lower than its previous support.
Takeaway
Use the OBV divergence as a confirmation layer: enter a short only after the OBV shows a sustained sell'side shift.
** 'Market Cap & Liquidity: A Low'Liquidity Bear**
- Total Crypto Market Cap: down '0.28% daily, down '0.1309% in the last four periods.
- Liquidity: 0.00% (ultra'thin).
- Volatility: 0.81% (very low).
When the market cap shrinks and liquidity dries out, the price moves are less dampened by large traders. That creates a perfect environment for small'price swings that can be captured in a single day.
Risk factors
- Low liquidity can lead to whipsaws if a large player enters unexpectedly.
- Low volatility means tighter stop'losses; aim for a 1:2 risk'reward ratio.
Takeaway
Short the pair on a day trade with a tight stop 5'10 points above the entry and a target 10'20 points below.
'Short'Trade Blueprint
| Parameter | Value |
|---|---|
| Signal | Bearish BOS + OBV divergence |
| Entry | $3,320.10 (immediately after BOS) |
| Stop'Loss | $3,325.00 ('5 points above) |
| Take'Profit | $3,310.00 ('10 points below) |
| Position Size | 0.25' of your total capital (risk ' 2%) |
| Confidence | 70/100 (highly probable short swing) |
Trade Type ' DAY (scalp if you're on the 5'minute timeframe, but we're targeting the daily swing).
Market ' BULL' NO ' it's a BEAR market for ETH at this moment.
'What to Watch Next
- Price action at the $3,325 support ' if it breaks, consider a new short with tighter stop.
- OBV trend change ' a reversal of the OBV dip could signal a short turn'around.
- Market'cap trend ' a sustained downtrend could widen the target.
** Final Thought**
If the market's structure tells you one thing'prices are falling'but you're still hunting for that next profit'boosting move, a well'timed short could be your answer. Remember: a move in the right direction with a tight stop is often more valuable than a huge upside with a wide stop.
Ready to turn the tables on ETH'
Join my next webinar on 'Capturing the Bearish Momentum' and learn how to harness these exact signals in real time. [Sign Up Now](https://yourtradingacademy.com)
#ETHShortsForProfit
#ETHToSellNow