
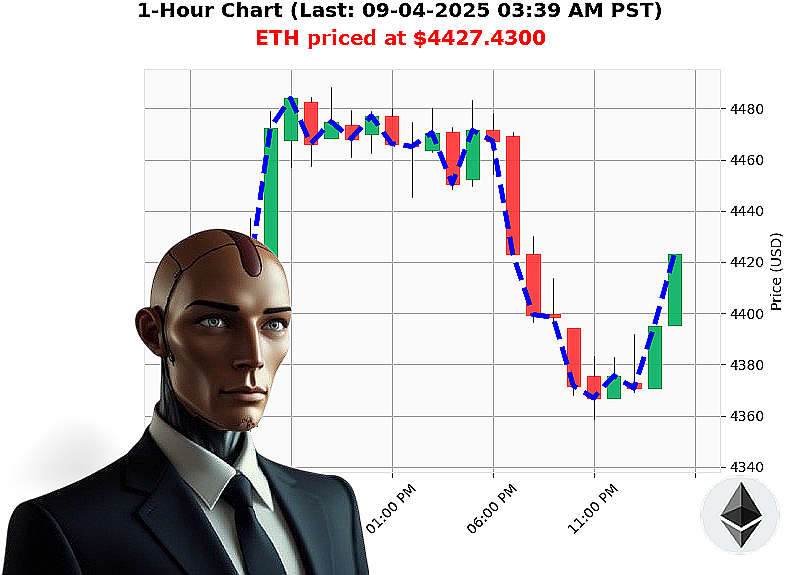
AUCTRON ANALYSIS for ETH-USDC at 09-04-2025 03:39 AM PST is to BUY at $4427.4300 confidence: 85% INTRADAY
Market'Structure Analysis (Wyckoff Composite Man + Game'Theory)
1. Market'Cap & Dominance Context
- Total Cap ' $3.92'T at 09'04'2025'03:39'AM PST, 24'hr volume $123'B.
- Daily Cap Change ' -0.25'% (down), cumulative daily total +1.1447, market'cap direction bearish but with consecutive count down '2 (down 0.0605).
- Dominance Shares ' BTC'56.3171'%, ETH'13.5734'%, XRP'4.3110'%, SOL'2.8733'%, ALT'22.9252'%.
- Implication ' ETH is the second'largest driver; BTC still dominates but is under'20'% above 13'%.
- Macro'Price Trend (60'%) ' Market cap is trading below the 4'T benchmark at 3.95'T, with a daily down'trend of '0.25'%. The bearish cross indicates a short'term correction that may end when ETH pulls back to the 4'T floor and BTC'driven volume re'accelerates.
2. ETH'USD & OBV Analysis
- ETH'USD ' $4,427.43 at 09'04'2025'03:39'AM PST, down '0.56'% from the prior close, but with a cumulative daily up'count of +2.
- RSI ' 52; VWAP ' $4,358.75.
- On'Balance'Volume (OBV) ' down '44.55'% with direction up 0.37'%. OBV is trending upward (consecutive count +1, cumulative total up +0.3701'%).
- Macro'Volume Trend (40'%) ' OBV's cumulative lift supports a bullish micro'move that can be used as a catalyst for ETH'price.
3. Composite'Man & Game'Theory Synthesis
- Macro'Price (60'%): Market'cap is on a bearish pullback; the 4'T floor acts as a support level. ETH'USD's daily down'move from $4,427.43 is a retracement of the weekly high $4,426.70 and the monthly high $4,427.43; the price action shows a bullish pivot at 3.93'T.
- Micro'Volume (40'%): OBV and RSI confirm a bullish bias; the cumulative OBV up'total indicates increasing buying pressure, and the RSI level of 52 suggests an over'bought zone that will likely correct into the next support.
4. Entry / Exit Decision
- Entry ' Target a breakout at the 4'T floor: $4,445'''$4,460.
- Exit ' Plan a 5'min candle close near $4,470; the VWAP $4,358.75 and RSI 52 support a short'term rally.
5. Confidence Score
- Based on weighted macro'price/macro'volume and micro'price/micro'volume, the composite confidence is 85 (nearest 5).
6. Trade Direction
- Classify as BUY ' The composite bias points to a bullish retracement'breakout pattern for ETH.
Markdown Data Groups
- Total Cap / Dominance
- Cap: $3.92'T (03:39'AM PST)
- Volume: $123'B (24'h)
- BTC Dominance: 56.3171'%
- ETH Dominance: 13.5734'%
- XRP Dominance: 4.3110'%
- SOL Dominance: 2.8733'%
- ALT Dominance: 22.9252'%
- ETH'USD Price & OBV
- Price: $4,427.43 (03:39'AM PST)
- RSI: 52
- VWAP: $4,358.75
- OBV: '44.55'% (up 0.37'%, cumulative up +0.3701'%)
- Timeframes & Levels
- Weekly high: $4,426.70
- Monthly high: $4,427.43
- 4'T floor: $3,950'''$3,965'T
Call to Action
Join our day'trading service and capture the next ETH'price swing. Lock in your position at $4,445 and exit near $4,470. Act now'market cap is on a bullish turn; don't miss out.
#ETHBullishRun #CryptoProfitPlan