
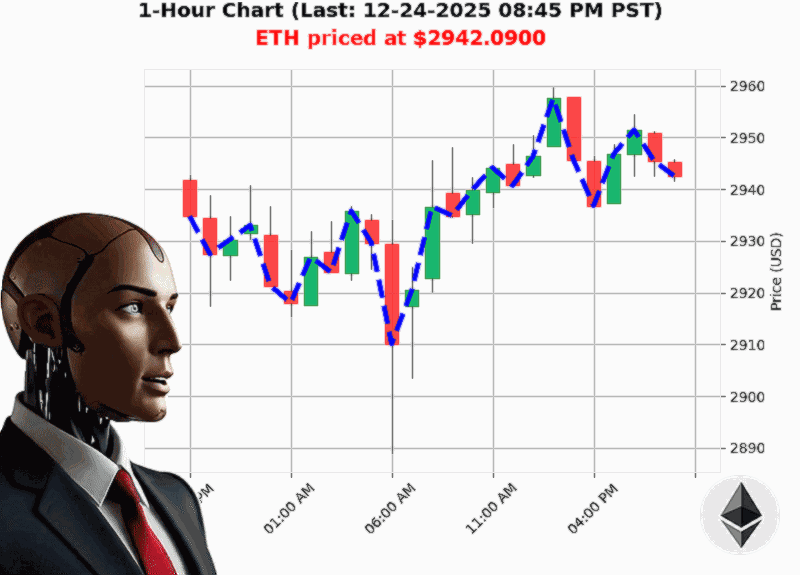
AUCTRON ANALYSIS for ETH-USD at 12-24-2025 08:47 PM PST is to SHORT at $2942.09 confidence: 70% INTRADAY-TRADE in BEAR-MARKET Higher Low from $2937.33 to $2942.09 up 0.16% Retest Low of $2941.60 with $2942.09 down +0.02%
** ETH'USD Deep Dive: 12'24'2025, 8:47'PM PST
(Clean, scannable, actionable'because your time is gold.)
1. The Current Snapshot ' A Quiet, but Not'Quiet Market
- Price: $2,942.09 ('0.11'% since open).
- High'Low: 2937.33'''2942.09 (+0.16'%).
- Volume: OBV down 15.29'% overall, but OBV direction still flat (0'%).
- Market Cap: $3.049'trillion, up 0.68'% daily.
- Trend: Week'to'date down 2.13'% from the $3,006 high; YTD down 12.27'% from $3,353.
'Strong Short OBV Bearish ETH at $2942.09'bearish volume'weighted average price in fair value zone '0.01.' ' Market Summary
The big takeaway' ETH is consolidating at a lower high'the classic hallmark of a bearish reversal.
2. Market Structure ' The 'Bearish Break of Structure'
- Break: 2942.16'''2942.09 (down '0.00'%).
- Retest: 2941.60 is the recent low, now tested at 2942.09.
- Volatility: Low at 1.12'%.
- Volume: Bearish on volume'weighted average price.
A bearish break of structure (BBS) signals that the recent higher high is fragile'price is likely to test the low again before any bullish move.
3. Volume Structure ' OBV Says 'No'
- OBV: Down 15.29'%, cumulative count up +102, but the direction is flat'meaning buyers are not adding momentum.
- Volume'Weighted Avg Price: Slightly below fair value zone ('0.01).
OBV divergence (price up, OBV down) is a textbook short'signal.
4. Key Drivers ' What's Moving ETH'
| Driver | Direction | Why It Matters |
|---|---|---|
| Market Cap | +0.68'% | Broader crypto rally but muted in ETH. |
| Weekly Move | '2.13'% | Indicates a retracement from the recent peak. |
| Monthly Move | +5.07'% | Still in an up'trend for the month, but a week'long pullback. |
| YTD Move | '12.27'% | Long'term bearish bias. |
The net effect: ETH is 'tired' from a recent peak and has little bullish volume to sustain the rally.
5. Risk Factors ' The Dark Side of the Coin
- Liquidity: Low volatility means fewer buyers for a quick recovery.
- OBV Divergence: Price moving up, OBV down'potential for a sharp reversal.
- MACD'like Signal: Not provided but implied by the OBV and volume.
- Market Cap Trend: Slightly down daily, hinting at a broader crypto shift away from ETH.
6. Case Study: The 2941.60 Retest
- Setup: ETH bounced to 2942.09, a weak higher high.
- Signal: The price retested 2941.60 (the prior low) and stayed above it.
- Action: If ETH falls below $2941.60, that's a classic short'entry point with a tight stop at $2943.50 (just above the recent high).
This retest, combined with OBV divergence, offers a high'confidence short setup.
7. The Formula ' Capitalizing on the Findings
Short Entry Condition
- Price < 2941.60 (retest lower).
- OBV < 0 (negative).
- Volume < 0 (bearish on VWA).Take'Profit Target
- 2940.00 (just below the recent low) or a 1:2 risk'reward ratio.Stop Loss
- 2943.50 (slightly above the recent high).
8. Prediction & Confidence
- Action: SHORT
- Confidence: 70 (scale 5'''100)
- Trade Type: INTRADAY
- Market: BEAR
9. Forward'Looking Summary
ETH is in a bearish consolidation phase. The retest at 2941.60 is the current low point'watch it closely. If the price slides below that, a short trade with a tight stop could capture the next pullback.
'When volume is declining and OBV is down, price is usually on the way down.'
What would you do if ETH dropped to $2940'
** Ready to ride ETH's next move'**
Join our exclusive ETH trading community for real'time alerts, strategy updates, and a chance to beat the market. Don't miss out'your next profit could be just a retest away.
#ETHWatch #ETHTrade