
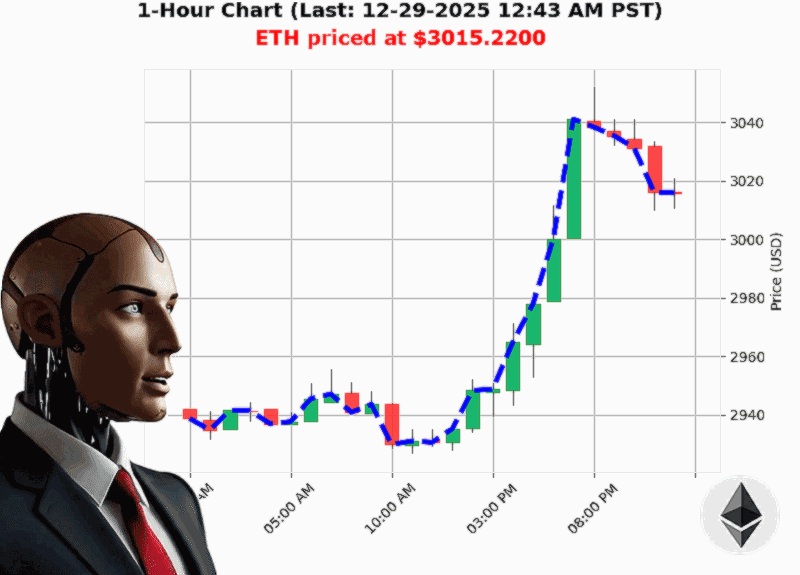
AUCTRON ANALYSIS for ETH-USD at 12-29-2025 12:45 AM PST is to BUY at $3015.22 confidence: 70% SCALP-TRADE in RANGE-MARKET Higher Low from $2944.26 to $3015.22 up 2.41% Swing Low from $3019.26 to $3015.22 down -0.05% Retest Low of $3013.40 with $3015.22 down +0.06%
5 Takeaways From the Latest ETH'USD Snapshot (12'29'2025)
** A 'Higher Low' is Still the Bear'Bait
ETH closed at $3,015.22, up 2.41'% from the prior higher low of $2,944.26**.
In a trend'following context, a higher low is a classic bullish signal. It suggests that buyers are stepping in at a new support level.
'Higher low from $2944.26 to $3015.22 up 2.41%'
Why it matters: If the price keeps moving above the recent swing low, you could be looking at a short'term rally.
** A Subtle 'Bearish Fair'Value Gap' Signals Caution
A fair'value gap between $3,015.79 and $3,016.63 shows a brief bearish bias'price briefly dipped below the fair'value zone.
While the gap is tiny ('0.05'%**), it's a warning that the market is still testing that boundary.
'Bearish Fair Value Gap from $3015.79 to $3016.63 down -0.05%'
Why it matters: A gap can act as a micro'support; if it holds, the price may bounce back.
** OBV Signals a Possible Reversal, but Volume Is Lively
OBV is up 115'%, yet the OBV direction is '0.64'%. This indicates that the bullish volume surge is relatively new, and the momentum may not be sustainable.
High liquidity of 5.10'%** further confirms that the market is ready for a quick move.
'On Balance Volume is up 115.14% with obv direction down -0.64%'
Why it matters: OBV can confirm a price move if it stays bullish; a reversal may happen if OBV fails to maintain the trend.
** Market Cap Trends Hint at a Wider Bearish Trend
Total crypto market cap is up 1.85'% today but the daily direction is down '0.0719'%. The cap also just crossed below $3.120'trillion**.
'Market Cap Direction Bearish Crossed below 3.120 at 3.114 trillion down -0.19%'
Why it matters: A bearish cap trend often precedes a down'trend in major tokens like ETH, especially when combined with the bearish fair'value gap.
** Weekly & Monthly Outlook Remains Bullish'Year'to'Date Is Not
- Week'to'date: +2.26'% from $2,948.57
- Month'to'date: +7.68'% from $2,800.19
- Year'to'date: '10.09'%** from $3,353.50
'ETH at $3015.2200 is up 2.26% from week to date price of $2948.5681 ' down -10.09% from year to date price of $3353.5042'
Why it matters: The short'term bullishness is strong, but the long'term slide indicates potential resistance near the all'time high.
Tactical Takeaway: What Should You Do'
- Trade Type: SCALP (intra'day)
- Signal: BUY (anticipate a micro'bounce off the fair'value gap)
- Confidence Score: 70 (moderate'high, based on higher low + bullish OBV)
- Market Condition: Range'BULL (bullish in the short'term, but contained within a slightly bearish cap environment)
Why a scalp'
The market is poised for a quick, short'term rebound. The price is sitting just above the fair'value gap and a minor swing'low dip has already occurred. In a range'bull setting, the next move will likely be a brief rally before the trend settles.
Ready to Trade ETH'
If you're hungry for that next scalp opportunity, join our elite signal group and get real'time alerts that help you profit from ETH's micro'moves. Don't let the next wave slip past you.
'The best traders are the ones who stay alert and act when the data points align.'
Click the link in bio to get instant access.
Final Thought
With ETH's price flirting with the fair'value gap and OBV hinting at a reversal, can you spot the exact moment to jump in and capture the next short'term rally'
#ETHRebound #ETHTrade
Your crypto edge starts here.