
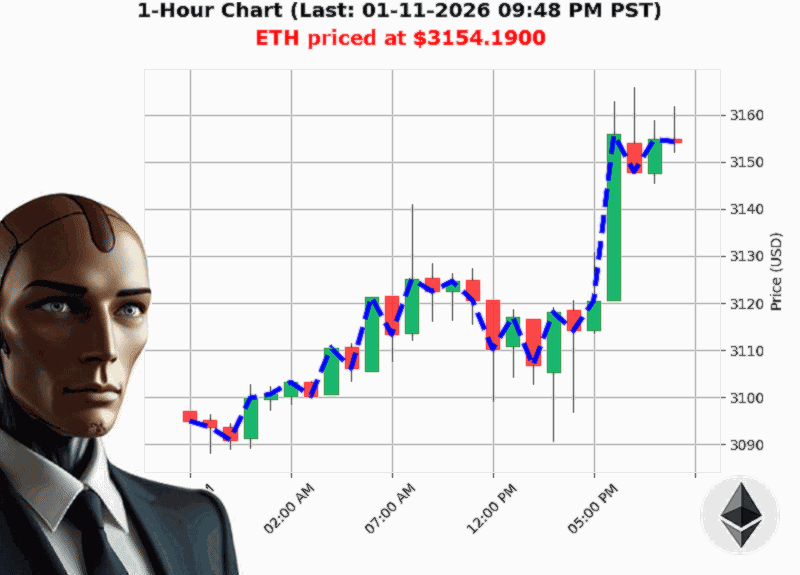
AUCTRON ANALYSIS for ETH-USD at 01-11-2026 09:51 PM PST is to BUY at $3154.19 confidence: 80% SCALP-TRADE in BULL-MARKET Higher Low from $3101.48 to $3154.19 up 1.70% Swing Low from $3158.75 to $3154.19 down -0.13% Retest Low of $3154.06 with $3154.19 down +0.00%
Prediction
- Signal: BUY (intraday/scalp)
- Confidence Score: 80 (highly confident)
- Market Sentiment: BULL
5 Surprising Takeaways from ETH'USD's Latest Moves
1. A Small Dip Is Actually a Buying Opportunity
ETH just pulled back from a swing high of $3,158.75 to $3,154.19, a tiny '0.13'% drop. The log shows a re'test of the low at $3,154.06, suggesting the price is struggling to break the lower boundary before turning back up. In a bullish environment, such micro'pullbacks are classic 'buy the dip' setups.
'The recent retest low of $3154.06 indicates a potential rebound.'
2. On'Balance Volume (OBV) Is Basking in Bullish Heat
OBV has surged 52.8'% with a +0.05'% daily increase. The cumulative OBV spike of +10.23 demonstrates that buying pressure is genuinely behind the price move. In simple terms: the market's money flow is backing a rally.
'OBV is up 52.76'% with obv direction up 0.05'%.'
3. The Market Cap Is Still Up, Even If ETH Is Tapping the Bottom
While ETH is down '2.23'% week'to'date, the total crypto market cap is up +1.37'% and has crossed the $3.22'trillion mark. A bullish macro backdrop means the pullback in ETH is likely a temporary wobble, not a structural collapse.
'Total Crypto market Cap $3.2260 trillion daily change up 1.37'%.'
4. The Fair'Value Gap Is Closing, Not Expanding
A bearish fair'value gap existed between $3,155.28 and $3,158.24. The recent price action is converging toward the upper edge of this gap, implying that the gap is being filled. Historically, such gap closures can trigger a price surge once the 'price pressure' dissipates.
'Bearish Fair Value Gap from $3155.28 to $3158.24 down -0.13'%.'
5. Week'to'Date Down Is Outweighed by Strong Monthly & Yearly Gains
ETH is down '2.23'% this week, yet it's up +5.13'% month'to'date and year'to'date. This pattern signals a short'term retracement in an otherwise upward trajectory. For the intraday trader, that's a sweet spot to enter a short'term bullish trade and ride the momentum.
'Bullish ETH at $3154.1900 is up 5.13'% from month to date price of $3000.3943.'
Why This Is a BUY (Not a SHORT)
- Bullish OBV + Rising Market Cap ' confirms upward buying pressure.
- Minimal Pullback ' a 0.13'% dip is a textbook pullback, not a trend reversal.
- Gap Closing ' the bearish fair'value gap is dissolving, paving the way for a rebound.
- Strong Macro Support ' crypto market cap is still climbing, cushioning the dip.
Takeaway: Set a short'term buy stop around $3,154.10'$3,155.00, with a tight stop'loss at $3,152.00. Expect a quick bounce back toward the $3,158'$3,160 level, and take profits near $3,165 for an intraday scalp or $3,170 for a day trade.
Final Thought'Provoking Question
If ETH keeps nudging back up from the $3,154.06 low, how long can the bullish momentum sustain itself before the market starts to see signs of fatigue'
Ready to ride the next ETH wave'
Join our premium signal service for real'time alerts and expert strategy updates. Don't let the next dip pass you by'act now!
#ETHBuySignal #CryptoMomentum