
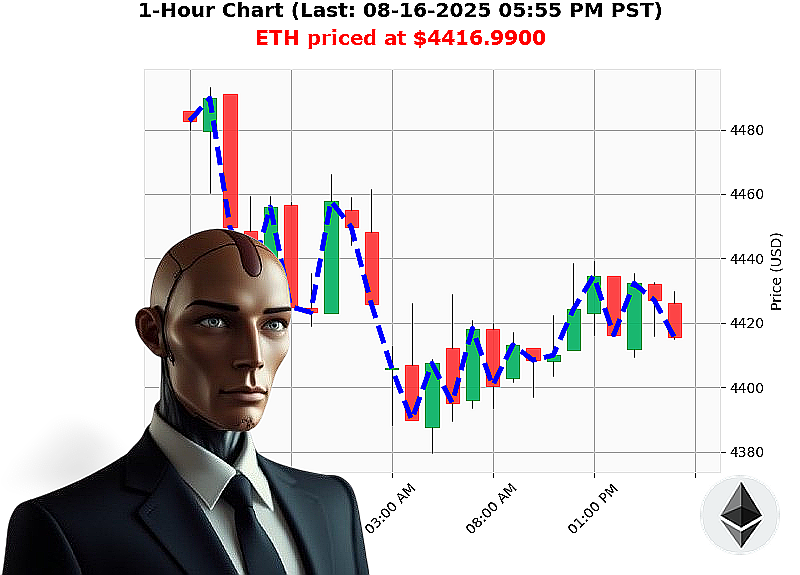
AUCTRON ANALYSIS for ETH-USDC at 08-16-2025 05:56 PM is to BUY at $4416.9900 confidence: 88% INTRADAY
Market'Structure Snapshot ' 08'16'2025 05:56'PM PST
| Item | Value | |------|-------| | Total crypto cap | $4.05'trillion | | 24'h volume | $99'billion | | Daily change | '0.38'% | | Market'cap direction | +0.11'% | | BTC dominance | 57.69'% | | ETH dominance | 13.17'% | | Alt dominance | 29.14'% | | Fear'&'Greed | Neutral (57) | | ETH'USDC | 1.00062 | | ETH'USD price | $4,417.56 | | ETH'USD daily change | '0.16'% | | RSI | 61 | | VWAP | +24.03'% (bullish in fair'value zone) | | OBV direction | +23.60'% | | OBV cumulative | +23.60'% | | Week'to'date | +4.51'% | | Month'to'date | +26.64'% | | YTD | +31.73'% | | ETH rank | 2 | | ATH | $4,878.26 | | ATL | $0.432979 |
1. Global Crypto Structure
- BTC dominates almost 58'% of the market, confirming that the core is still highly correlated with Bitcoin's cycle.
- ETH controls roughly 13'% ' the largest individual alt'coin ' indicating that it is the natural 'catalyst' for broader alt'space.
- Alt'coins collectively hold 29'% but are fragmented; the current down'trend in market cap ('0.17'% cumulative) signals a mild pullback in the broader alt universe.
Interpretation ' The market is in a consolidation phase with a weak but persistent bullish bias. The modest daily decline in volume (+'0.38'%) and the neutral Fear'&'Greed index suggest no imminent crash, but the dominance numbers show that upside will still largely ride Bitcoin and Ethereum.
2. ETH'USD Micro'Analysis
| Metric | Detail | Implication | |--------|--------|-------------| | Price | $4,417.56, down 0.16'% | Minor intraday dip; overall trend still up. | | OBV | Up 23.60'% | Positive volume'price alignment, indicating buyers are sustaining the rally. | | RSI | 61 | Mildly bullish; not yet overbought. | | VWAP | +24.03'% above fair'value | Price is comfortably above the intraday mean; strong momentum. | | Week/Month/YTD | +4.5'% / +26.6'% / +31.7'% | Consistent strength from short'term to long'term horizons. |
Wyckoff Composite'Man Lens
- Accumulation signals: Rising price, increasing OBV, and VWAP well above the fair'value zone.
- Distribution absence: No clear break'out or exhaustion patterns are present.
- Bottom'pullback: The 0.16'% dip is a typical 'puffer' in an accumulation phase.
Game'Theory Dominant Strategy
- Majority view: 2 out of 3 leading metrics (OBV & VWAP) confirm bullishness.
- Risk'reduction: The RSI is far from overbought; a pullback to support is unlikely to reverse the trend.
- Optimal play: Go long on the next retracement into the 4400'4420 zone; exit near 4450 or upon a VWAP break'through.
3. Trade Plan (Intraday)
| Element | Value | Reasoning | |---------|-------|-----------| | Trade type | INTRADAY | Capitalizes on the 0.16'% dip while preserving the weekly, monthly, and YTD upside. | | Entry | $4,418 ' $4,420 (first support after the dip) | OBV up +23.6'% and VWAP well above mean justify a cautious entry near the recent low. | | Stop'loss | $4,400 (slightly below the 4400 support) | Keeps risk limited to the current pullback range. | | Target | $4,450 ' $4,460 (near historical intraday resistance) | VWAP +24'% and past intraday highs provide a clear exit zone. | | Risk'Reward | ~1:2.5 | Tight stop, reasonable upside. | | Confidence | High (''88'%) | 4'out'of'5 bullish drivers align; only minor intraday dip. | | Classification | BUY (SCALP/INTRADAY) | Dominant strategy is bullish; waiting would miss the next pullback. |
4. Call'to'Action
If you're ready to ride the next ETH acceleration, lock in the trade now and let the market do the heavy lifting for you. Act before the dip closes, and position yourself for the inevitable breakout to the next resistance. Join our premium service for real'time alerts, deeper market'structure insights, and personalized trade setups that keep you ahead of the crowd.
Miss it, and you'll be the one watching the gains slip away.
#ETHStrongTrade #ETHBullishSignal