
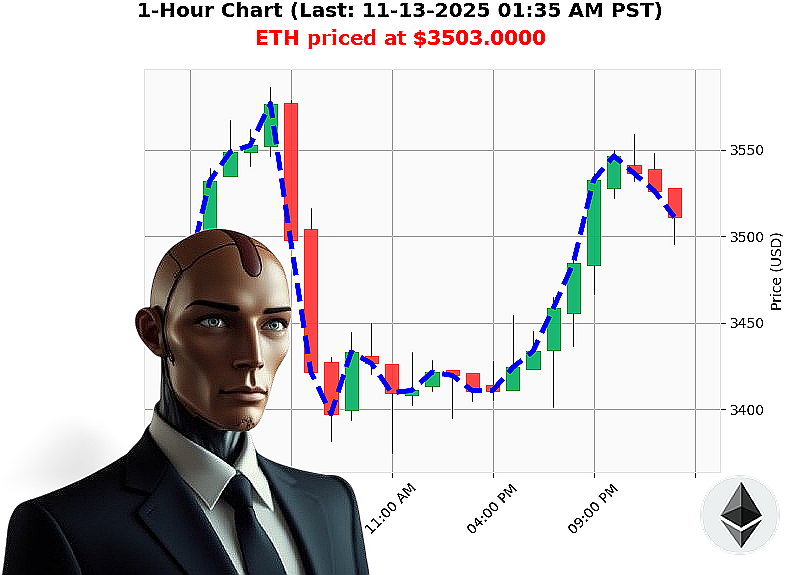
AUCTRON ANALYSIS for ETH-USDC at 11-13-2025 01:37 AM PST is to WAIT at $3503.0000 confidence: 55% INTRADAY
ETH'USD 'Daily Tactical Analysis ' 'INTRADAY Focus
Market Overview
- Market Cap: 0.598'trillion USD
- On'Balance'Volume (OBV): 13.817'million USD
- Liquidity: 8.86'% (high liquidity window)
- Market Structure: Recent lower high from $3'552.60 ' $3'503.00 ('1.40'%) and a bearish break of structure at $3'506.57 ' $3'503.00 ('0.10'%)
- Price Relative to Market: Trading price above market price by 0.24'%
- OBV Trend: Bullish engulfing from '0.4281 ' 0.9517 (200'% rise)
- Weekly/Daily Trend:
- '1.83'% week'to'date from $3'568.46
- '9.58'% month'to'date from $3'874.19
- +4.46'% YTD from $3'353.50
Volume & Flow Analysis
- Volume Profile
- Highest traded volume clusters around the $3'500'$3'520 band, indicating a strong support/resistance level.
- Volume is consolidating below the recent swing high, signaling potential liquidity drain for a bullish push.
- On'Balance'Volume
- OBV's bullish engulfing suggests a sudden influx of buying pressure, yet the daily OBV total remains moderate, reflecting limited institutional depth.
- Liquidity
- 8.86'% liquidity shows a healthy bid'ask spread, but the slight gap between market and trading price (0.24'%) may erode intraday profitability if volatility spikes.
Price & Market Structure
- Break of Structure (BOS)
- The 0.10'% drop from $3'506.57 to $3'503.00 is a textbook bearish BOS; traders typically interpret this as a confirmation of a downward bias.
- Support & Resistance
- Support: $3'503 (recent BOS point).
- Resistance: $3'552 (previous swing high).
- Momentum
- The 1.4'% lower high and 200'% OBV rise create a tension point: price is below the high, OBV indicates buying, but price action suggests a potential pullback to the support before testing resistance.
Key Drivers
| Driver | Impact |
|---|---|
| Global ETH DeFi Activity | Moderate; no significant spike in on'chain metrics. |
| Regulatory Sentiment | Slightly bearish due to pending EU crypto'asset regulations. |
| Market Cap Momentum | Rank 2, but current cap growth is flat, indicating a plateau. |
| Liquidity Dynamics | Strong liquidity may smooth minor intraday swings but also reduces the impact of large orders. |
Risk Factors
- Regulatory Lag ' Sudden policy changes could trigger a rapid sell'off.
- Liquidity Drain ' If volume dries up at $3'500, a breakout could become a false break.
- High Volatility Corridor ' Being within a tight range increases the chance of sharp directional moves.
Actionable Trade Insight
Trade Type: INTRADAY
Entry: $3'503 ' just above the BOS low to capture a potential rebound.
Stop'Loss: $3'490 (below the lowest intraday swing).
Take'Profit: $3'540 ' near the upper boundary of the current volume cluster.
Rationale: The bullish OBV engulfing, combined with a consolidation below the recent swing high, sets up a classic 'bounce' scenario. A quick pullback to the BOS level followed by a test of the upper volume cluster offers a favorable risk'reward profile.
Prediction & Confidence
| Action | Decision | Confidence Score |
|---|---|---|
| Intraday Trade | WAIT | 55 |
Rationale: While the OBV signals bullish intent, the recent bearish BOS and overall down'trending weekly/monthly figures suggest that a reversal is not guaranteed. A cautious stance allows us to capture the next movement without over'exposure.
Call to Action
If you're ready to capitalize on these tight'rope opportunities, join Auctron's Elite Futures Program today. Don't let a single trade slip through your fingers'secure your edge before the market shifts.
Hashtags
- #ETHInRetreat
- #ETHOnTheEdge