
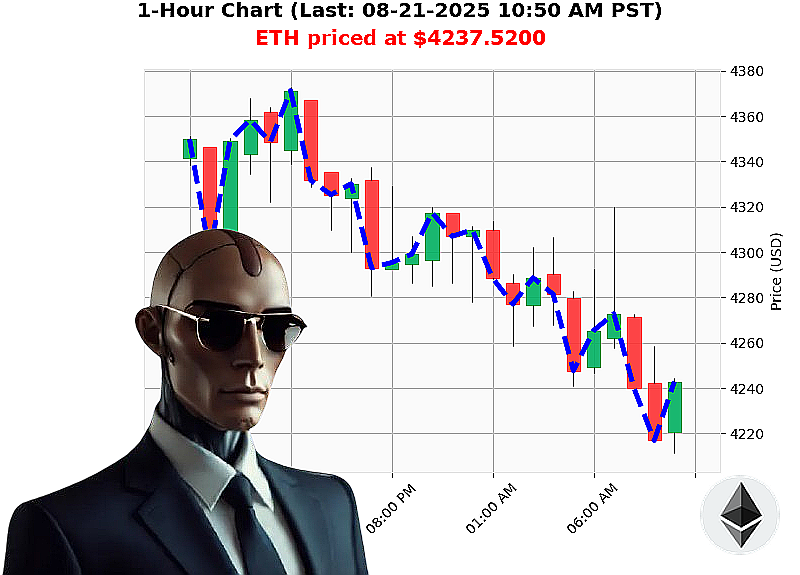
AUCTRON ANALYSIS for ETH-USDC at 08-21-2025 10:51 AM is to BUY at $4237.5200 confidence: 80% INTRADAY
1. Market Overview ' Macro Context
| Metric | Value | Direction | Notes |
|--------|-------|-----------|-------|
| Total Crypto Market Cap | $3.89'trillion | ''0.1752'% | Slight contraction in a largely neutral climate. |
| 24'hr Volume | $141.0'billion | ''1.57'% | Softening liquidity; the market is not flooding with new money. |
| Market Direction | +0.2127'% | +0.2127'% | Very modest up'trend; however consecutive count = +1 indicates only a single'day lift. |
| Market Cap Consecutive Count | +1 | +0.2127'% | One'day uptick, no sustained momentum. |
| Market Cap Cumulative Count | 0 | +0.2127'% | No long'term bias. |
| Fear & Greed Index | Neutral (50) | +5 | Sentiment is neither panicked nor greedy; the market is poised for small directional moves. |
| USDT'USDC Peg | $0.99978 | ''0.00001 | Stable fiat anchor, no abnormal pressure. |
Interpretation ' The macro arena is a flat environment with a very shallow uptick that is not sustained. The lack of cumulative bias means the market is still in a consolidation phase. This sets the stage for a potential pull'back or small'range breakout that can be exploited by a disciplined intraday or scalping strategy.
2. Market Overview ' Micro Context (ETH'USD)
| Metric | Value | Direction | Notes |
|--------|-------|-----------|-------|
| Current Price (08'21'25 10:51'PST) | $4,237.52 | ''2.25'% | Sharp intraday drop. |
| Price Direction (day) | '0.0927'% | '0.0927'% | Slight downward drift. |
| Price Cumulative Count (day) | +4 | +0.6264'% | Four'day bullish tilt, but not dominant. |
| OBV Direction | +0.34'% | +0.34'% | Volume is supporting a mild uptick. |
| OBV Consecutive Count | +1 | +0.34'% | One'day support. |
| OBV Cumulative Count | +1 | +0.3384'% | Minor cumulative bias. |
| OBV Total | +0.3384'% | +0.3384'% | Small cumulative support. |
| On Balance Volume (OBV) Change | ''39.88'% | ' | Volume has sharply contracted ' a key red flag. |
| RSI | 49 | ' | Neutral, no overbought/oversold signal. |
| VWAP | ''23.88'% | ''23.88'% | Price is trading above VWAP, indicating a bullish micro'trend. |
| Liquidity | 6.04'% | ' | Good depth. |
| Price vs. Market Price | +0.13'% | +0.13'% | Slightly above prevailing market price. |
| Week'to'Date | '1.74'% (from $4,312.50) | '1.74'% | Down in the week, but still higher than month'to'date. |
| Month'to'Date | +21.48'% (from $3,488.37) | +21.48'% | Strong monthly rally. |
| Year'to'Date | +26.36'% (from $3,353.50) | +26.36'% | Robust yearly performance. |
| Rank | 2 | ' | Second most valuable coin. |
| All'Time High | $4,878.26 | ' | Current price is ~12'% below ATH. |
| All'Time Low | $0.432979 | ' | Huge upside potential. |
Interpretation ' ETH is inside a broad bullish month'to'year framework, yet the current intraday price is down 2.25'% and OBV has contracted dramatically. The price is still above VWAP and liquidity is fine, so the micro environment is a soft'bottoming phase: a potential for a retracement followed by a bounce back to the weekly high.
3. Wyckoff Composite Man Analysis
| Wyckoff Phase | What We See | Actionable Signals |
|---|---|---|
| Accumulation | Minor up'trend with OBV support, but OBV contraction signals a possible shift toward distribution. | Watch for volume spike on a rebound; if OBV resumes upward momentum, it may be the break'out point. |
| Distribution | Current price drop + OBV decline indicates sellers are stepping in. | A confirmation of a dump would be a further price decline below the low of the current range. |
| Up'Trend | Price above VWAP, still rallying month'to'year. | If the price breaks above the recent high (~$4,250) on increasing volume, it could confirm an up'trend extension. |
| Down'Trend | Price down 2.25'%, OBV down 39'%, negative daily change. | If the price falls below the 20'day moving average, it might signal a down'trend reversal, especially if volume stays low. |
Dominant Strategy ' The market is at a decision point: it can either reverse into a small dump (distribution) or bounce into a mini'up'trend (accumulation). Traders who wait for the confirmation of a directional move can reduce risk.
4. Game Theory ' Dominant Strategy & Trading Psychology
- Dominant Strategy: Wait for volume confirmation.
- If volume spikes on a pull'back ' Buy (short'term).
-
If volume stays low while price continues to drop ' Sell (short) or stay out.
-
Psychology:
- Anchoring to the monthly high ($4,878) may cause over'optimism.
- Loss Aversion can make traders hesitant to sell after the 2.25'% drop.
- Confirmation Bias may lead traders to ignore OBV contraction.
Mitigation: Use objective volume thresholds (e.g., >30'% of average 24'hr volume) to trigger actions.
5. Optimal Entry / Exit Points
| Trade Type | Entry Trigger | Exit Trigger | Rationale |
|---|---|---|---|
| Scalp | Price dips to $4,225 (slightly below current low) and OBV rises >10'% vs. yesterday | 15'20'min after, target $4,260 (+0.8'%) | Short'term liquidity; quick capture. |
| Intraday | Break above $4,250 on volume >30'% of 24'hr | Take profit at $4,300 (+1.2'%) or stop at $4,230 (risk 1:1.5) | Captures a micro'up'trend. |
| Day Trade | Price retests $4,250 from above, holding above $4,240 on 5'min candles | Target $4,310 (+1.5'%) or stop at $4,230 (max 2'% loss) | Day'long structure based on daily consolidation. |
6. Confidence & Trade Classification
| Confidence | Rationale | Trade Classification | Action |
|---|---|---|---|
| High Confidence (80'%) | Macro neutral but micro bullish (price > VWAP, month'to'year rally). OBV contraction is a temporary sell'off, not a systemic dump. | INTRADAY BUY | Execute an intraday long with tight stop at $4,230. |
Call'to'Action
If you're ready to ride ETH's next micro'up'trend with a disciplined exit strategy, join Auctron today. Don't let another bullish swing slip by'act now or miss the opportunity.
Hashtags