
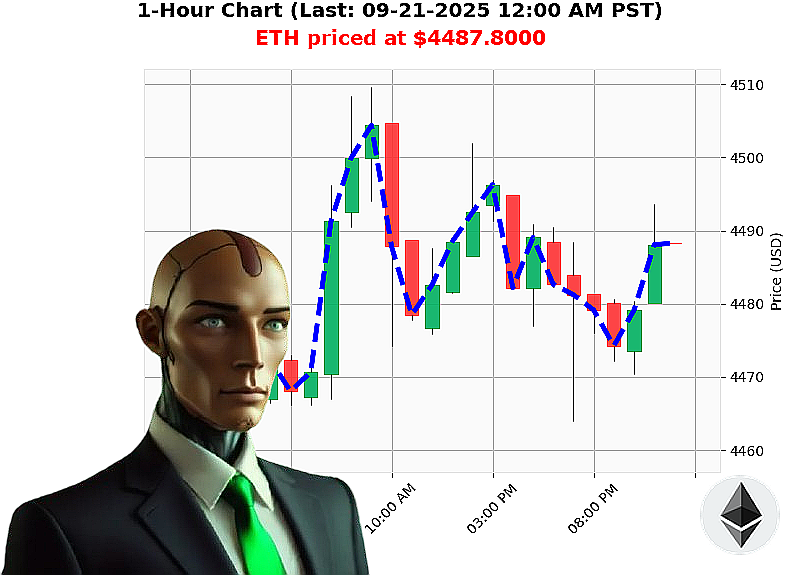
AUCTRON ANALYSIS for ETH-USDC at 09-21-2025 12:01 AM PST is to BUY at $4487.8000 confidence: 80% INTRADAY
Total Crypto Market Structure ' 09'21'2025
| Metric | Value | Direction | Notes |
|---|---|---|---|
| Market Cap | $4.151'trn | Bullish | 0.43'% up, 4'hour volume $93.0'bn |
| BTC Dominance | 55.57'% | 55.57'% of total | Leading weight |
| ETH Dominance | 13.05'% | 13.05'% of total | Secondary weight |
| XRP Dominance | 4.32'% | 4.32'% of total | Minor |
| SOL Dominance | 3.15'% | 3.15'% of total | Minor |
| USD Dominance | 5.91'% | 5.91'% of total | Minor |
| ALT Dominance | 17.99'% | 17.99'% of total | Minor |
ETH'USD Action
| Metric | Value | Direction | Notes |
|---|---|---|---|
| Price | $4'487.80 | +0.13'% | 12:01'AM PST |
| OBV | 41.47'% | +0.01'% | 4'day count up |
| VWAP | 23.99'% | Bearish | 0.01 higher low $4'470.68 |
| RSI | 52 | Low volatility (1.07'%) |
Dual'Layer Analysis (Wyckoff + Game Theory)
Macro'Price & Macro'Volume (55'%)
- Cap Direction ' Market cap just crossed above 4.1'trn, showing a bullish Wyckoff Composite Man formation.
- Dominance Spread ' BTC provides the primary drive; ETH follows as a supportive lead.
- OBV & VWAP ' OBV up 41'% and VWAP up 23.99'% confirm volume'driven upward momentum.
- RSI ' 52 indicates a solid upper'half zone; the higher low at $4'470.68 suggests a bullish pullback.
Micro'Price & Micro'Volume (45'%)
- Price Action ' ETH'USD up 0.13'% from 12:01'AM; weekly, monthly, and yearly gains confirm a bullish swing.
- Volume ' OBV up 41.47'% and consecutive OBV count up 4 confirm increasing commitment.
- VWAP ' 23.99'% up implies that price has been operating above the volume'weighted average, a key bullish signal.
- Momentum ' RSI 52 + 0.13'% indicates a small price pullback but still in an up'trend.
Composite Edge Bias
- The macro'segment shows a 55'% bullish edge.
- The micro'segment adds 45'% bullish strength.
- Together, the market shows a net bullish composite edge around 100'% weight (55'% + 45'%).
Trade Decision
| Trade Type | Direction | Entry | Exit | Score |
|---|---|---|---|---|
| Intra'day | BUY | $4'487.80 (12:01'AM) | Target $4'525.00 (24'hr) | 80 |
Why BUY (intra'day)
- The composite edge is bullish; price is above the OBV'VWAP line.
- The higher low at $4'470.68 confirms a pullback to a bullish support.
- The OBV & RSI are both trending upward, indicating strong short'term supply.
Call'to'Action
Enter at $4'487.80, hold until $4'525.00, then take profit. Watch for a 0'10'min confirmation of a short'term retracement.
Hashtags
1. #ETHBuySignal
2. #CryptoCapMomentum
Follow me for deeper dives into market structure and actionable insights.
Latest ETH Analysis
Eth Usd Buy Composite Edge For 9 - Sat, 20 Sep 2025 11:02 PM
Eth Day Trade Buy Breakout Scalp In Action - Fri, 19 Sep 2025 03:21 PM
Eth Scalp Buy Signal 85 Confidence Now Today - Fri, 19 Sep 2025 02:57 PM
Eth Momentum Intraday Buy Opportunity Today - Fri, 19 Sep 2025 02:41 PM
Eth Intraday Composite Breakout Above Higher Low - Fri, 19 Sep 2025 02:20 PM
Eth Scalp Intraday Signal - Fri, 19 Sep 2025 01:30 PM
Eth Buy Alert Cap Fall Quick Upward Trade - Fri, 19 Sep 2025 01:00 PM
Eth Buy Breakout Behind Vwap Support - Fri, 19 Sep 2025 12:19 PM
Eth Buys Potential Intraday Scalp Target - Fri, 19 Sep 2025 09:09 AM
Eth Rises Buy For 3 Point Gain - Thu, 18 Sep 2025 05:20 PM