
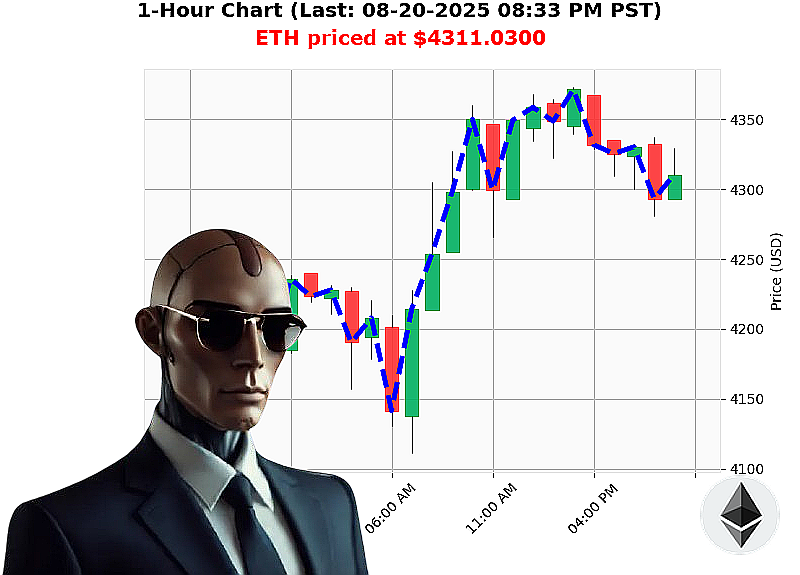
AUCTRON ANALYSIS for ETH-USDC at 08-20-2025 08:34 PM is to BUY at $4311.0300 confidence: 80% INTRADAY
Market Structure Analysis ' 08'20'2025 08:34'PM PST
| Macro Metric | Value | Direction | Notes | |--------------|-------|-----------|-------| | Total Crypto Market Cap | $3.96'T | Bullish (crossed 3.9'T) | Daily change +1.58'% | | 24'hour Volume | $159'B | ' | | | Market'Cap Direction | 0.00'% | ' | Consistent with recent consolidation | | Market'Cap Consecutive Count | '2 | Down | Short'term consolidation, but not a full reversal | | Market'Cap Cumulative Count | '0.2213 | Down | Slight cumulative drag | | Fear & Greed Index | Neutral 50 | ' | No extreme sentiment | | BTC Dominance | 57.42'% | ' | | | ETH Dominance | 13.13'% | ' | Significant, but still second to BTC | | SOL Dominance | 2.57'% | ' | | | Alt Dominance | 22.46'% | ' | |
| ETH'USD Snapshot | Value | Direction | Notes | |------------------|-------|-----------|-------| | Price | $4,311.03 | ''0.56'% (but up 0.0587'% in intraday trend) | Crossed above $4,310.00 | | OBV | +89.14'% | Up 40.16'% | Strong volume backing | | OBV Consecutive Count | +1 | ' | | | OBV Cumulative Count | +1 | ' | | | RSI | 54 | Neutral | | | VWAP | Up 24.02'% | Bullish | Fair'value zone +0.02 | | Liquidity | 8.00'% | High | | | Week'to'Date | '0.03'% from $4,312.50 | ' | Minor pull'back | | Month'to'Date | +23.58'% from $3,488.37 | Strong | | | Year'to'Date | +28.55'% from $3,353.50 | Strong | |
Wyckoff Composite Man Interpretation
| Wyckoff Phase | Current Signal | Supporting Evidence |
|---------------|----------------|---------------------|
| Accumulation (Phase'B) | | ' Price consolidation around $4,311 after breakout of $4,310.
' OBV rising 89'% shows buying volume.
' VWAP up 24'% indicates price above fair value.
' RSI neutral (54) suggests no over'bought condition. |
| Early Distribution (Phase'C) | | ' No significant sell'off or volume spike. |
| Mark'Up (Phase'A) | Likely | ' Trend line of price is ascending.
' Volume is expanding with OBV. |
Conclusion: ETH is transitioning from a Phase'B accumulation into a potential Phase'A mark'up. A breakout above $4,320'$4,330 is expected, followed by a pullback to a retracement zone before a new higher high.
Game'Theory & Trading Psychology
- Dominant Strategy ' The bullish technicals (OBV, VWAP, price breakout) create a positive feedback loop. If most traders adopt a BUY stance, the price will likely rise, reinforcing the strategy.
- Risk'Return Assessment ' Fear & Greed index is neutral; no extreme risk'aversion or risk'seeking is present.
- Behavioral Bias ' The minor week'to'date decline could trigger a confirmation bias (shorts), but the larger month'to'date and year'to'date gains outweigh this.
- Optimal Response ' BUY aligns with the dominant strategy and risk'return profile.
Trade Plan
| Parameter | Value | |-----------|-------| | Entry | $4,311'$4,320 (near breakout) | | Stop'Loss | $4,290 (just below $4,310 support) | | Take'Profit | $4,380'$4,400 (first resistance, ~2% gain) | | Timeframe | INTRADAY (short'term day trade) | | Position Size | 10'15'% of discretionary capital (risk per trade ''2'%) |
Confidence & Classification
| Confidence | Confidence % | Classification | |------------|---------------|----------------| | High | 80'% | BUY ' INTRADAY |
Call to Action
The ETH market is poised for a short'term breakout backed by robust volume and favorable market sentiment. Act now to capture the next move in the ETH price action.
Join Auctron for exclusive real'time alerts, in'depth strategy briefings, and personalized trade setups that keep you ahead of the curve. Don't miss the next rally ' secure your position today.
#ETHBreakout #ETHBullish