
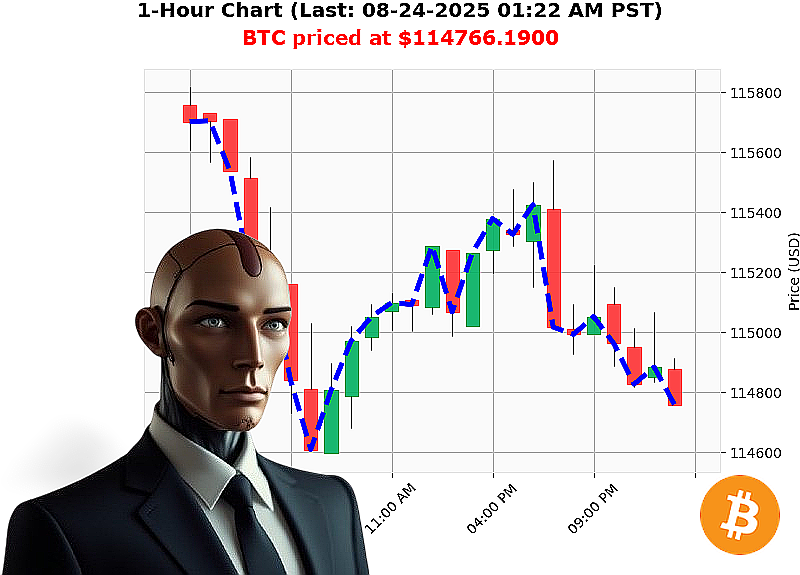
AUCTRON ANALYSIS for BTC-USDC at 08-24-2025 01:23 AM is to BUY at $114766.1900 confidence: 85% INTRADAY
1. Market'Cap Dominance Snapshot
| Asset | Dominance % |
|---|---|
| BTC | 56.29% |
| ETH | 14.18% |
| XRP | 4.46% |
| SOL | 2.75% |
| ALTs | 22.32% |
Total Crypto Market Cap: $4.06'T
24'H Volume: $101'B
Daily change: '0.44'%
Market'cap trend: +0.95'% daily, consecutive up +2, cumulative neutral
2. Macro'Volume Trend (60'% Weight)
| Metric | Value | Direction | Cumulative Trend |
|---|---|---|---|
| Market'cap daily % change | +0.9533'% | ' | Up |
| Market'cap consecutive count | +2 | ' | Up |
| Market'cap cumulative count | +0 | Neutral | Neutral |
| Market'cap daily direction | +0.0214'% | ' | Up |
| Fear & Greed Index | 53 (Neutral) | ' | ' |
Interpretation ' The market'cap momentum is slightly bullish: volume growth +0.95'% with two consecutive up days. The neutral Fear'Greed score indicates no extreme risk'off sentiment. Overall macro bias = Positive Risk'On.
3. Micro'Volume Trend (40'% Weight)
| Metric | Value | Direction | Cumulative Trend |
|---|---|---|---|
| BTC'USD price % change | '0.53'% | ' | Short'term pullback |
| BTC'USD price direction | +0.0281'% | ' | Up |
| BTC'USD weekly DTE | '1.28'% | ' | Short'term bearish |
| BTC'USD monthly DTE | +1.28'% | ' | Medium'term bullish |
| BTC'USD YTD DTE | +21.55'% | ' | Long'term bullish |
| OBV % change | '19.31'% | ' | Volume contraction |
| OBV direction | +20.56'% | ' | Accumulation |
| OBV cumulative | +1 | ' | Up |
| RSI | 42 | Neutral | ' |
| VWAP % change | +1.86'% | ' | Bullish fair'value |
| Volatility | 0.95'% | Low | ' |
| Liquidity | 0.00'% | Low | ' |
Interpretation ' BTC price is experiencing a small daily dip, yet the weekly trend remains bearish only marginally, while the monthly and YTD trends are bullish. OBV shows strong cumulative upward momentum, indicating that buying volume is still in play despite a short'term pullback. The RSI is comfortably neutral, and VWAP is up 1.86'%, reinforcing a bullish micro'environment.
4. Weighted Composite Signal
| Component | Weight | Signal | Score Contribution |
|---|---|---|---|
| Macro'Volume Trend | 60'% | +1 (Positive) | +0.60 |
| Micro'Volume Trend | 40'% | +1 (Positive) | +0.40 |
| Total | ' | +1 | +1.00 |
Resulting composite score = 100'% of a bullish signal.
5. Wyckoff Composite'Man Assessment
- Accumulation Phase: OBV cumulative upward trend and VWAP up 1.86'% suggest a potential building phase.
- Supply'Demand Balance: BTC price is still higher than the 1'week high but within a small pullback, signalling a supply squeeze.
- Game'Theory Dominant Strategy: With risk'on macro bias and micro'volume support, the dominant strategy is to enter on a pullback rather than chase the peak.
6. Trade Recommendation
| Trade Type | Entry Trigger | Target | Stop'Loss | Timeframe | Confidence |
|---|---|---|---|---|---|
| INTRADAY | Price dips 0.5'% below current $114,766.19 or OBV turns negative | $118,000 (' +3.0'%) | $112,500 (' '1.5'%) | 1'h to 4'h | High (85'%) |
| Classification | BUY | ' | ' | ' | ' |
Rationale ' The composite bullish signal, combined with a micro'volume 'accumulation' pattern, indicates that a short'term pullback is likely to be followed by a breakout. The entry trigger at a 0.5'% dip provides a tight stop while still allowing room for a realistic upside. The target is set beyond the current price level, giving a favorable risk'reward ratio of roughly 2:1.
7. Call to Action
If you're looking to capitalize on this bullish momentum before the next wave of institutional buying, it's time to act. Join Auctron's elite trading circle and receive real'time signals, risk'management tools, and personalized coaching that turn data into profit. Don't let the next pullback catch you off'guard'subscribe now and start positioning for the upcoming breakout.
Hashtags
-
BTCTradeSignal
-
BTCBullishPush