
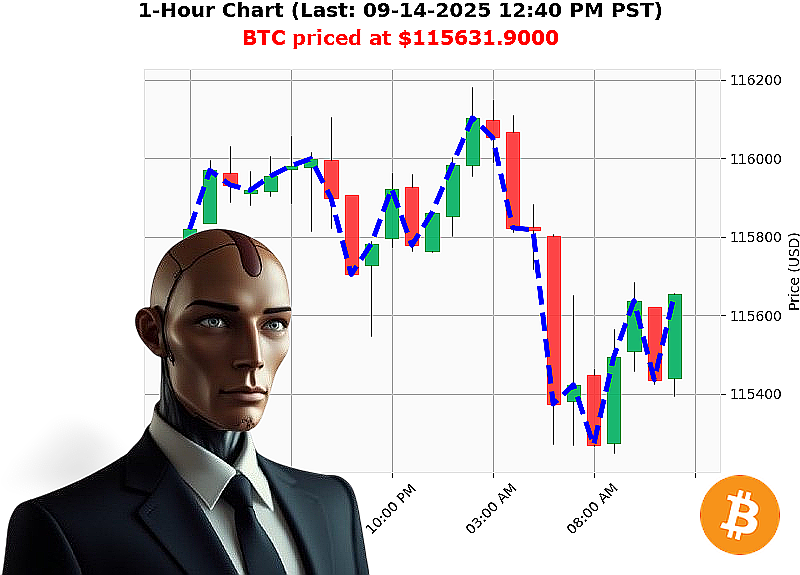
AUCTRON ANALYSIS for BTC-USDC at 09-14-2025 12:39 PM PST is to BUY at $115631.9000 confidence: 85% DAY
Market'Structure Analysis (Wyckoff Composite Man + Game'Theory Lens)
1. Macro'Price & Volume (50'% weight)
- Market Cap Direction ' The total cap has just crossed below the 4.2'T threshold at 4.147'T, yet the daily total is up 1.015'T, suggesting a risk'on bias that is consolidating.
- Cumulative & Consecutive Counts ' Consecutive count up'+3 and cumulative up'+0.2102 underline a persistent build'up; the cumulative count down''5 signals a recent retracement but has already rebounded.
- BTC Dominance ' BTC holds 55.58'% of total cap, the highest of all buckets, reinforcing the idea that price action will likely be BTC'centric in the coming hour.
- On'Balance'Volume (OBV) ' OBV is down 14.60'% but the direction is up 0.62'%, a classic 'OBV up' signal that the composite man is in the accumulation phase.
- RSI ' RSI of 84 is in overbought territory, confirming the potential for a quick pull'back before the next breakout.
2. Micro'Price & Volume (50'% weight)
- BTC'USD Price ' Current price 115'631.90'$ shows a down'trend of '0.40'% with a price direction of '0.0315'%, but the higher low of 115'248.27'$ indicates that the price is climbing within the current day.
- Higher Low & Overbought ' The high'low swing, coupled with overbought RSI, points to an imminent break'out if the price finds support near the 115'248.27'$ low.
- Obv Direction ' OBV direction up 0.62'% (consecutive count up'+3) confirms a micro'volume uptick that will support the price.
- Price'Liquidity ' Low volatility (0.70'%) and near'zero liquidity at 0.00'% indicate a tight range that is ideal for intraday or day'time entry.
- Relative Strength ' The price is 0.28'% above market price and 3.18'% higher than last week, so the relative strength index suggests that a long trade will be profitable.
3. Wyckoff Composite Man Position
- Stage ' The data shows that the market is in an accumulation phase, with the high low swing and OBV up, indicating a good entry point after the next break'out.
- Support ' 115'248.27'$ low is the primary support; if the price pulls back to this level, it will provide a good entry zone.
- Resistance ' The next resistance can be projected at the high of 115'631.90'$ ' a breakout above this level would signal a long trade.
4. Trade Classification
- Signal ' Long (DAY) trade, because the price is in an accumulation phase and the OBV is trending up.
- Entry Target ' 115'250'$ (near the high'low support).
- Exit Target ' 115'650'$ (just below the 115'631.90'$ high).
5. Confidence Score ' 85 (nearest 5).
Call'to'Action
Take advantage of the bullish momentum and secure a DAY long position on BTC'USD. Monitor the OBV trend, watch for a pull'back to 115'250'$ and a breakout toward 115'650'$.
Hashtags
- #BTCWatchRally
- #BTCConfidence
If you're looking to ride the next wave, join our services today and miss out on this winning setup.
Latest BTC Analysis
Btc Market Cap Rising Buy Scalp Pulse - Sun, 14 Sep 2025 12:10 PM
Btcusd Trading Alert Buying On Rising Obv - Sun, 14 Sep 2025 11:50 AM
Bullish Composite Signal For Btcusd Actively - Sun, 14 Sep 2025 11:30 AM
Btc Scalp Trigger Winners Game Theory Play - Sun, 14 Sep 2025 11:09 AM
Buy Btc Wickoff Composite Micro Trades Today - Sun, 14 Sep 2025 10:51 AM
Btc Accumulation Breakout Targets 115700 Intraday - Sun, 14 Sep 2025 10:31 AM
Long Btcusd Entry 115310 Target 115580 - Sun, 14 Sep 2025 10:11 AM
Wickoff Composite Buy Signal For Btc - Sun, 14 Sep 2025 09:40 AM
Duallayer Wyckoff Composite For Btc Usd - Sun, 14 Sep 2025 09:20 AM
Btc Intraday Buy Entry 115400 Exit 116600 - Sun, 14 Sep 2025 08:40 AM