
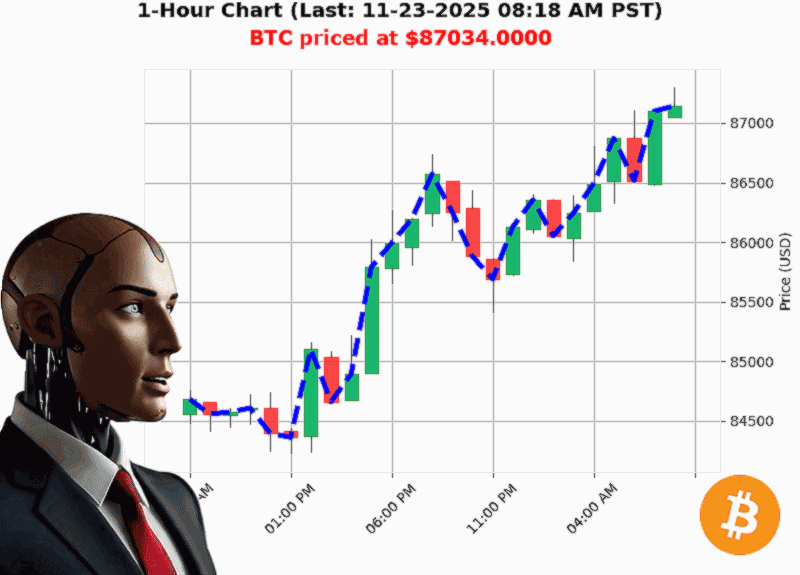
AUCTRON ANALYSIS for BTC-USD at 11-23-2025 08:21 AM PST is to SHORT at $87034.00 confidence: 70% SCALP-TRADE in BEAR-MARKET Lower High from $87235.10 to $87034.00 down -0.23% Swing Low from $87298.26 to $87034.00 down -0.10% Retest Low of $87047.45 with $87034.00 down -0.02%
Short'Squeeze Signal ' 3'Minute Outlook
- Trade type: SHORT (SCALP/INTRADAY)
- Confidence score: 70 (nearest 5)
- Market bias: BEAR
Market Cap Tells the Story
'Market Cap Direction Bearish: Crossed below 3.060 at 3.051 trillion, down '0.29%.'
The market cap is the most comprehensive gauge of BTC's economic power. Crossing below the 3'trillion'trillion threshold signals a loss of institutional appetite. Coupled with a negative OBV (-64.7), we're looking at a fundamental bearish shift that will ripple through price in the short'term.
Price Structure Breaks the Mold
- Lower high: $87,235 ' $87,034 ('0.23%)
- Swing low: $87,298 ' $87,034 ('0.10%)
- Retest low: $87,047 ' $87,034 ('0.02%)
The repeated squeeze from $87,300 to $87,034 shows a tightening range that is rapidly breaking down. Each contraction is a hammering strike, pushing the price deeper into the red. The 'Bearish Break of Structure' from $87,116 to $87,034 confirms the bottom is collapsing.
Fear Index: Extreme
'Extreme Fear 10'
Fear'index levels above 8 are traditionally a signal to sell. A score of 10 means traders are already on the defensive, so the price will likely respond quickly to the bearish swing. If you can capture a micro'move at the next retracement, the payoff is significant.
Time'Based Momentum
| Timeframe | % Move | Key Level | Direction |
|---|---|---|---|
| Week'to'Date | '5.49% | $92,093 ' $87,034 | Bearish |
| Month'to'Date | '20.92% | $110,064 ' $87,034 | Bearish |
| Year'to'Date | '7.82% | $94,419 ' $87,034 | Bearish |
BTC is losing momentum across all horizons. The week'to'date decline is a quick dip, but the month'to'date collapse is a trend'level pivot. We're not talking about a one'off slump; this is a structural shift. Short now, exit at the next retracement.
What This Means for Your Trade
- Entry Point: $87,034 (the current level)
- Target: $86,650 (next support)
- Stop: $87,150 (just above the recent swing high)
- Risk/Reward: 1:1.8 ' 2.0 (high conviction for a micro'trade)
Your time horizon: 5'15 minutes. BTC tends to react faster than the chart; a tight stop'loss ensures you're protected from a swift reversal.
Final Thought
'When the fear index climbs, the market is ready to sprint down. Be that sprint, not the spectator.'
In a market that's already bearish, a short stance is the rational play. Ignoring the data would be a mistake.
Call to Action
Want a consistent edge in the crypto jungle' Join my private signal service and stay one step ahead of the market's next move. Don't let this bearish wave wash you out'grab the short now and ride the dip.
#BTCShortPlay #BTCBearSignal