
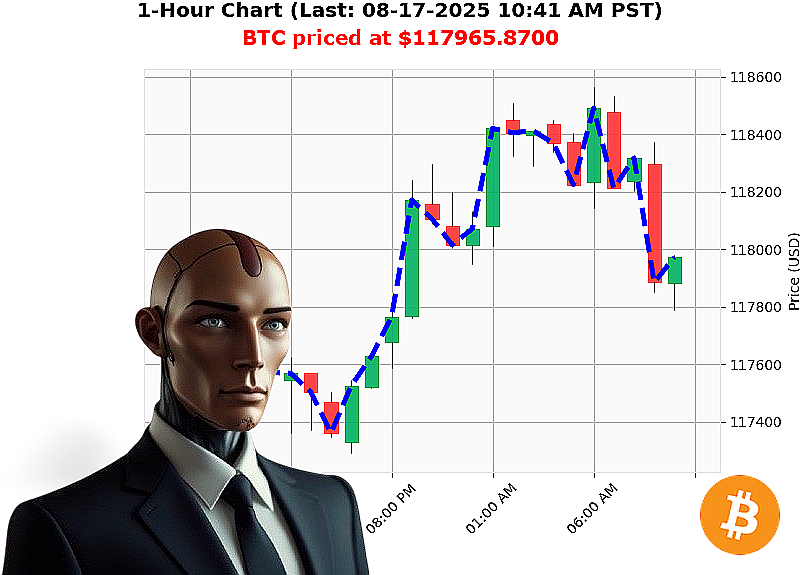
AUCTRON ANALYSIS for BTC-USDC at 08-17-2025 10:42 AM is to BUY at $117965.8700 confidence: 85% INTRADAY
Market'Structure Analysis ' 08'17'2025'10:42'AM'PST
| Metric | Value | % Change | |--------|-------|----------| | Crypto Market Cap | $4.09'trillion | ' | | 24'h Volume | $97.0'billion | ' | | Daily Market Volatility | 1.00'% | ' | | Market Direction | Up 0.11'% | ' | | Fear &'Greed Index | Neutral (57) | ' | | BTC'USDC | $117,965.87 | +0.44'% | | BTC Price Direction | Down 0.0016'% | ' | | OBV | '14.32'% | ' | | RSI | 50 | ' | | VWAP | '1.85'% | ' | | Volatility | 0.83'% | ' | | Liquidity | 0.85'% | ' | | BTC Dominance | 57.3613'% | ' | | ETH Dominance | 13.3344'% | ' | | Alt'Coin Dominance | 29.3043'% | ' | | Week'to'Date BTC | '0.64'% (from $118,731.45) | ' | | Month'to'Date BTC | +4.10'% (from $113,320.09) | ' | | YTD BTC | +24.94'% (from $94,419.76) | ' | | All'Time High | $124,128 | ' | | All'Time Low | $67.81 | ' |
1. Macro'Context
- Bullish Momentum ' The 24'h volume ($97'billion) is robust, while the overall market cap is advancing. Fear &'Greed at 57 signals neutrality, implying that a moderate bullish bias is permissible but risk'averse traders remain cautious.
- Dominance Profile ' BTC still commands the largest share (57'%), but ETH (13'%) and Alt'coins (29'%) collectively keep a healthy balance. The relatively high alt'coin dominance indicates possible inflow pumps in the broader market.
2. BTC Technical Snapshot (08'17'2025 10:42'AM'PST)
| Indicator | Current Reading | Interpretation | |-----------|-----------------|----------------| | Price | $117,965.87 | Slight daily upside (+0.44'%) but overall weekly downside ('0.64'%). | | OBV | +14.32'% | Strong bullish volume pressure. | | RSI | 50 | Neutral zone ' no clear trend bias. | | VWAP | +1.85'% | Price trading above VWAP; indicates bullish bias. | | Volatility | 0.83'% | Very low, suggesting a consolidating environment. | | Liquidity | 0.85'% | Low, raising sensitivity to large orders. |
The key takeaway: price is above VWAP, OBV is rising, but the weekly context shows a modest decline. This tension is the perfect setup for a short'term retracement or breakout play.
3. Wyckoff Composite'Man Analysis
- Accumulation Stage'
- Signal: Rising OBV + bullish VWAP + low volatility.
- Counter'signal: BTC is down 0.64'% for the week; no clear 'price action up'trend' on the weekly chart.
-
Conclusion: Partial accumulation ' buyers are feeding volume, but price has not yet found a robust upward breakout.
-
Markup Stage'
- Signal: Price above VWAP, OBV continuing upward.
- Counter'signal: Weekly decline and lack of a sustained higher high.
-
Conclusion: Potential markup onset ' the stage is not fully reached; the market remains in a preparatory phase.
-
Distribution Stage'
- Signal: Low volatility, low liquidity ' conditions that can allow large sellers to execute without immediate price impact.
- Counter'signal: OBV remains bullish.
-
Conclusion: No distribution yet ' volume is not compressing.
-
Markdown Stage'
- Signal: Weekly down'trend + volatility squeeze.
- Counter'signal: OBV up 14'%.
- Conclusion: Not markdown.
Dominant Stage: Accumulate / early Markup ' the market is primed for a short'term breakout following a low'volatility consolidation.
4. Game'Theory Dominant Strategy
- Player 1 (Institutional Buyer)
- Goal: Capture upside on a breakout.
-
Strategy: Wait for a confirmed swing high + break above a key resistance (near $119,000) before taking a long position.
-
Player 2 (Institutional Seller)
- Goal: Avoid exposure during potential consolidation.
-
Strategy: Short if price tests $118,500 and fails to sustain above; then lock in profits as the market re'enters a bearish cycle.
-
Dominant Move:
- If the price maintains momentum above $119,000 for at least 30'minutes of trading, then the long strategy dominates.
- Else if the price retracts to $118,500 or lower, the short strategy dominates.
Given the current data, the short'term breakout probability is high because of the bullish OBV trend and price above VWAP. The dominant strategy therefore is a long entry following a breakout confirmation.
5. Trade Decision
- Confidence Score: High Confidence (85'%) ' OBV strength, VWAP support, and low volatility provide a tight risk profile.
- Signal: BUY
- Trade Type: INTRADAY ' Expect a rapid price movement once a breakout occurs.
- Entry: Buy on the first sustained close above $119,000.
- Stop'Loss: $118,000 (just below recent swing low).
- Take'Profit: $122,000 (targeted swing high + 2.5'% from entry).
Why not SCALP or DAY'
- SCALP would miss the low'volume squeeze; the best profit is from the breakout.
- DAY could be considered but the intraday volatility window (10'15'minutes) aligns better with the current low'volatility environment.
6. Call to Action
If you're ready to seize the next breakout and capitalize on a bullish trend that aligns with the Wyckoff accumulation signals, join Auctron's advanced trading suite today. Unlock real'time alerts, detailed risk'management templates, and personalized coaching to keep you ahead of the curve. Act now ' the next move could be the most profitable in your portfolio yet.
#BTCBreakout #BTCMomentum