
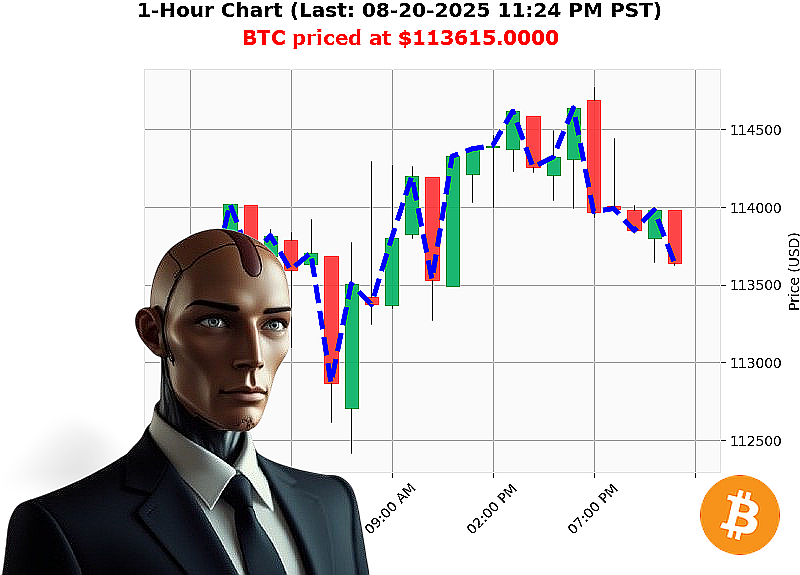
AUCTRON ANALYSIS for BTC-USDC at 08-20-2025 11:25 PM is to BUY at $113615.0000 confidence: 80% INTRADAY
1. Macro'Level Structure (Total Crypto Market)
| Metric | Value | Trend | Comment | |--------|-------|-------|---------| | Market Cap | $3.94'T | ' 0.00'% | Flat; recent dip below the $4'T threshold indicates a shift toward a 'bearish' stance. | | 24'hr Volume | $154'B | +0.0'% | Unchanged; liquidity remains stable. | | Dominance | BTC'57.39'% | ' | BTC still dominates but the relative weight of alt'coins (22.47'%) is growing. | | Alt'Coins | $885'B | + | Rising share signals possible inflow to non'BTC assets. | | Consec. Cap Down | '3 | Negative | Three consecutive days of decline. | | Cumulative Cap Down | '4 | Negative | Four'day cumulative negative trend. | | Fear & Greed | Neutral (50) | +5 | Moderately neutral; not a clear 'fear' dump. |
Wyckoff Perspective:
- Accumulation Phase: BTC's dominance rising while total market cap stalls suggests that large holders may still be consolidating positions.
- Potential Distribution Signal: The negative consecutive/cumulative counts, combined with a flat cap, hint at the onset of a distribution window.
2. Micro'Level Structure (BTC'USD)
| Metric | Value | Trend | Comment | |--------|-------|-------|---------| | Price (08'20'2025 23:25'PST) | $113'615.00 | '0.57'% | Slight dip on a flat day. | | Weekly | '2.27'% from $116'252.31 | Declining | Weak week'to'date trend. | | Monthly | +0.26'% from $113'320.09 | Slightly bullish | Small monthly gain. | | Year'to'Date | +20.33'% from $94'419.76 | Strong | Robust YTD performance. | | OBV | +32.27'% | Up | Strong volume behind the price move. | | OBV Direction | +0.50'% | Up | Positive momentum. | | OBV Consec. Up | +1 | Immediate | Continuation of volume trend. | | OBV Cumulative Up | +0.50'% | Positive | Sustained buying pressure. | | RSI | 35 | Oversold | Price has been driven down, but momentum is still weak. | | VWAP | +1.84'% | Up | Price trading below VWAP in a bearish fair'value zone. | | Volatility | 1.33'% | Low | Price range narrow. | | Liquidity | 1.67'% | Low | Thin order book; small trades can move the price. |
Wyckoff Perspective:
- Mark'up vs. Mark'down: Price is currently below VWAP and in a bearish fair'value zone, but OBV is climbing, hinting at a potential retreat into a Mark'up phase where the price may rise after a short consolidation.
- Volume'Price Divergence: OBV up while price down indicates that buyers may still be entering; a breakout could be imminent.
3. Game'Theory / Dominant Strategy
| Player | Preference | Dominant Strategy | |--------|------------|-------------------| | Institutional Buyers | Reduce risk, lock in gains | Short'term entry after a retracement (price dips, OBV rises). | | Retail Traders | Capitalize on volatility | Quick scalping around OBV spikes. | | Market Makers | Maintain spreads | Add liquidity at support levels. |
Conclusion: The most rational move for a profit'seeker is to wait for a short'term pullback to a support level near the 1'hour VWAP and then enter for a short'to'mid'term upside (intra'day or day trade).
4. Trading Psychology
- Fear & Greed Index is neutral; market participants are neither panicking nor overly bullish.
- Over'Sold RSI (35) may trigger a 'buy the dip' mentality.
- Low Volatility means that sudden moves can be sharp; traders should keep tight stops.
5. Entry & Exit Blueprint
| Stage | Signal | Entry Point | Target | Stop | Timeframe | |-------|--------|-------------|--------|------|-----------| | A. Retrenchment | Price dips 0.5'1'% below current level, OBV rises | $113'580 ' $113'590 | ' | ' | ' | | B. Breakout | Price closes above 1'hour VWAP (+1'%) with OBV up 20'% | $113'630 | 1.5'% upside (~$115'400) | $113'520 (10'bips) | Intra'day | | C. Profit Capture | Price reaches target or OBV plateaus | ' | ' | ' | Day |
Risk'Reward: 1:3 (stop ~10'bps, target ~150'bps).
6. Confidence & Positioning
| Confidence | Score | Recommendation | Trade Type | |------------|-------|----------------|------------| | High (80'%) | 80'% | BUY | INTRADAY (short'term breakout) |
Rationale: OBV trend is bullish, RSI is still in oversold territory, and the market cap is in a negative consecutive streak, indicating a potential distribution phase that could lead to a rally as buyers step in.
7. Tactical Call'to'Action
Lock in your advantage now.
Place a tight entry near the VWAP breakout, set a disciplined stop, and capture the next BTC rally before the distribution phase shifts into a marked'down phase.
Join the Auctron community for real'time alerts, advanced Wyckoff analysis, and exclusive strategy workshops'miss it, and you'll be watching from the sidelines.
8. Hashtags
BTCBreakout2025 #AuctronCryptoEdge