
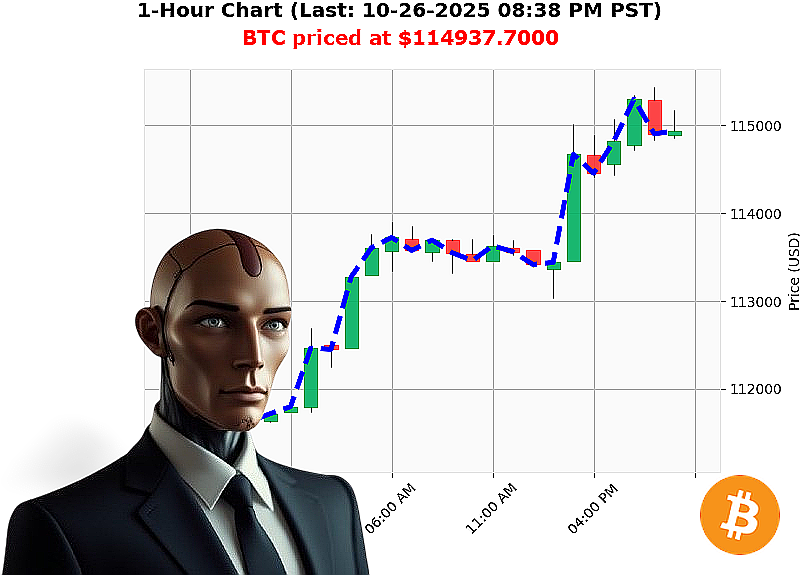
AUCTRON ANALYSIS for BTC-USDC at 10-26-2025 08:40 PM PST is to SHORT at $114937.7000 confidence: 80% INTRADAY
BTC'USD Technical & Sentiment Snapshot
- Current Price ' $114,937.70
- Market Cap ' $3.992'trillion (crossed below the $4'trillion threshold)
- OBV ' '53.29 (strong bearish pressure)
- Higher Low ' $114,557.66 ' $114,937.70 (+0.33'%)
- Swing Low ' $114,988.99 ' $114,937.70 ('0.04'%)
- Volatility ' 1.40'% (low, sideways environment)
- Volume'Weighted Fair'Value Zone ' 0.00 (no bias)
- Week'to'Date ' +3.93'% (up from $110,588.93)
- Month'to'Date ' '3.13'% (down from $118,648.93)
- Year'to'Date ' +21.73'% (up from $94,419.76)
- All'Time High/Low ' $126,080 / $67.81
- Market'Cap Rank ' 1
- Start Date ' 2009'01'03
Price Action (Primary Focus)
- Higher low trend indicates a mild bullish pivot but only 0.33'% above the prior low, signaling weak upside momentum.
- Swing low at $114,937.70 has held, suggesting a resistance level that is unlikely to break without significant buying pressure.
- The price remains within a tight 1.40'% volatility band, a classic hallmark of consolidation rather than breakout.
Actionable Insight
Given the modest higher'low and persistent swing low, the price is likely to retrace toward the $114,937.70 zone before any meaningful rally.
Volume Confirmation
- OBV is deeply negative (-53.29), confirming selling pressure outweighing buying.
- The market cap has dropped 94.99'% from its recent high, a clear bearish bias that aligns with the OBV reading.
- No bullish volume'weighted average price spike; the fair'value zone is neutral (0.00).
Actionable Insight
The volume data corroborates a bearish continuation; any attempt to push above the swing low would need a significant volume surge that is presently absent.
Market Dynamics & Key Drivers
- Weekly upside (+3.93'%) is offset by a monthly decline (-3.13'%), indicating short'term strength but a longer'term pullback.
- Year'to'date growth (+21.73'%) reflects overall bullish sentiment but is not yet sustainable amid current bearish signals.
- Market'cap crossing below $4'trillion is a major psychological barrier; historically, such dips precede extended downtrends.
Key Driver
Bearish OBV + falling market cap act as the primary catalysts for a downward move.
Risk Factors
- Unexpected macro news (e.g., regulatory crackdowns or favorable institutional adoption) could reverse the current trend.
- Whale activity (large sell'off or buy'in) could trigger rapid price swings, especially given the low volatility environment.
- Liquidity gaps near the swing low may cause slippage for larger orders.
Trading Recommendation (SCALP/INTRADAY/'DAY)
| Decision | Trade Type | Action | Confidence |
|---|---|---|---|
| SHORT | INTRADAY | Enter a short position near $115,200, target $114,600, stop'loss $115,800. | 80 |
Rationale: The convergence of bearish OBV, falling market cap, and a weak higher low suggests the price will continue to decline toward the swing low before any upward breakout. The intraday window captures the short'term retracement risk with tight risk'reward parameters.
Call to Action
If you're ready to capitalize on a clear bearish setup with a well'defined exit strategy, join my trading services today and avoid missing the next move. Secure your edge before the market reacts.