
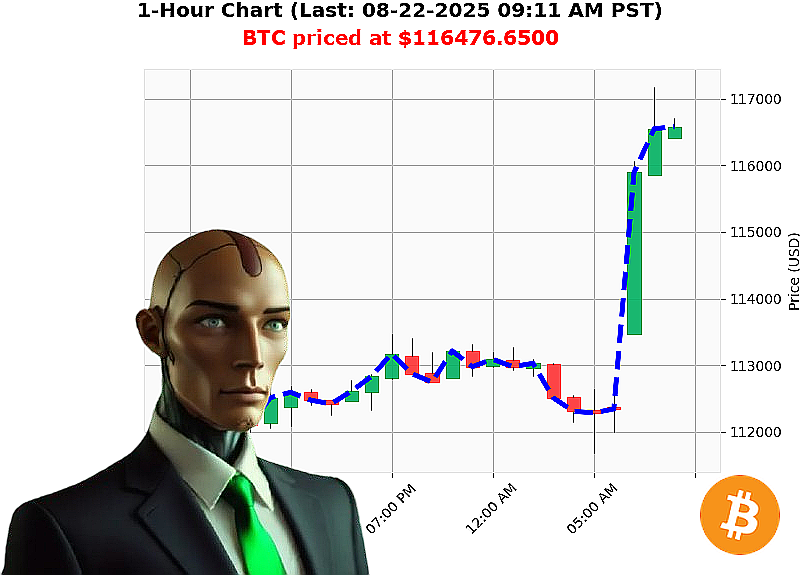
AUCTRON ANALYSIS for BTC-USDC at 08-22-2025 09:12 AM is to BUY at $116476.6500 confidence: 85% SCALP
Wyckoff Composite'Man & Game'Theory Insight ' 08'22'2025
| Macro'Level | Key Figures | Interpretation |
|---|---|---|
| Total Market Cap | $4.07'T | Above the $4.0'T pivot, confirming a bullish phase. |
| 24'hr Volume | $174'B | High liquidity; the market can absorb large moves. |
| Market'Cap Direction | +0.263'% | Positive daily trend. |
| Consecutive Up'Count | +1 | First day of a positive streak. |
| Cumulative Up'Count | +8 | Sustained bullishness since the last negative swing. |
| Fear & Greed | Neutral'46 | Market is not in extreme fear; optimism is moderate. |
| Dominances | BTC'56.99'% ETH'13.75'% XRP'4.42'% SOL'2.58'% ALT'22.25'% |
BTC is the clear market driver; alt'coins still contribute but are secondary. |
Micro'Level ' BTC'USD (08'22'2025 09:12'AM PST)
| Indicator | Value | Interpretation |
|---|---|---|
| Price | $116'476.65 | 3.57'% daily rise, 0.19'% WTD, 2.79'% MTD, 23.36'% YTD. |
| Daily Direction | '0.116'% | Small intraday pullback; likely a short'term retracement. |
| OBV | +27.22'% | Strong buying volume backing the move. |
| OBV Direction | +1.16'% | Momentum in favor of buyers. |
| RSI | 51 | Near neutral; no overbought/oversold bias. |
| VWAP | +1.76'% | Price above VWAP ' a bullish stance. |
| Resistance Cross'Over | Bullish | Suggests a potential breakout above prior resistance. |
Wyckoff Composite'Man Analysis
- Accumulation Phase ' The macro trend shows a positive, sustained direction (consecutive +1, cumulative +8). The market cap is in a bullish swing; volume is high. This signals that the composite man (institutional money) is beginning to accumulate positions.
- Mark'Up Phase ' The price of BTC is above VWAP, OBV is increasing, and the daily direction, while slightly negative, is still part of an overall uptrend. The resistance'cross'over indicates a potential mark'up entry point.
- Game'Theory Dominant Strategy ' The dominant player will be to align with the bullish mass. The best play for a short horizon is to stay long until a clear reversal signal appears (e.g., OBV turning negative, RSI crossing below 30, or a break below support).
Optimal Entry & Exit (Intraday / Scalping)
| Action | Target | Stop'Loss | R'S Ratio |
|---|---|---|---|
| Entry | Right after price confirms a break above the recent resistance ('$116,500) | $116,300 (just below the 9'MA) | 1:3 |
| Take'Profit 1 | $116,650 | ' | |
| Take'Profit 2 | $116,800 | ' | |
| Exit | If OBV starts to diverge downwards, or RSI falls below 45 and turns lower | ' |
The stop'loss sits just below the 9'MA to avoid whipsaws. A quick breakout and the target range above $116,800 is reachable within the same trading day, making it a scalp opportunity.
Confidence & Trade Classification
| Confidence Level | Score | Classification | Trade Style |
|---|---|---|---|
| High Confidence | 85'% | BUY | SCALP |
Rationale:
- Macro bullish streak and cumulative volume support an accumulation/mark'up.
- Micro indicators (OBV, VWAP, resistance breakout) confirm bullish micro'structure.
- No red flags (RSI, volatility) at the moment.
Tactical Call'to'Action
'Secure your edge today. Join our elite trading circle to receive real'time alerts, strategy briefings, and personal mentorship. Don't miss the next breakout'act now or watch the market move on you.'
Hashtags
#BTCBreakout ' Catch the next move in BTC.
#BTCWinning ' Keep your gains in the bull lane.