
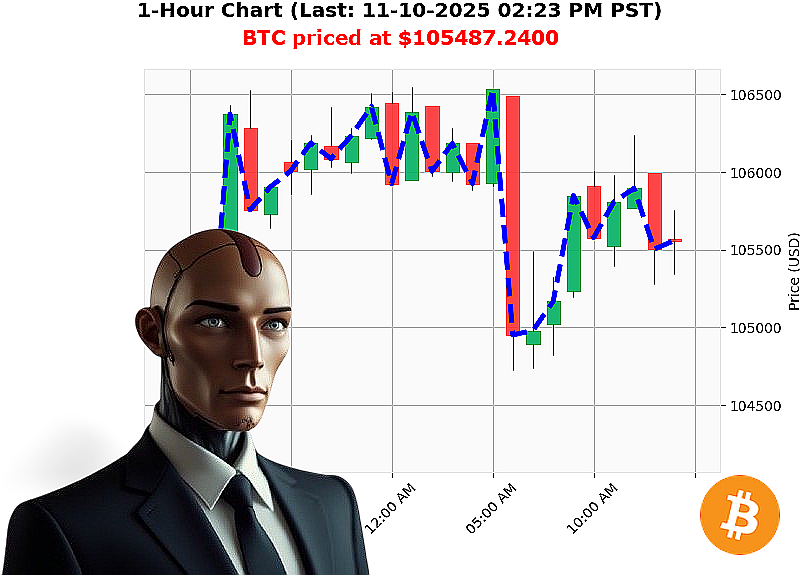
AUCTRON ANALYSIS for BTC-USDC at 11-10-2025 02:25 PM PST is to SHORT at $105487.2400 confidence: 70% INTRADAY
Financial Summary ' BTC'USD (USD/USDT)
Timeframe considered: INTRADAY (1'hour candles)
Market Structure
| Item | Detail |
|---|---|
| Market Cap Daily Total | $2.019'trn |
| Market Cap Direction | Bearish ' crossed below $3.650'trn threshold at $3.642'trn |
| All'time High/Low | $126'080 / $67.81 |
| Rank | 1 (global Bitcoin dominance) |
| Current Price | $105'487.24 (down from $105'500.00) |
| Week'to'Date | Up 0.73'% from $104'719.64 |
| Month'to'Date | Down 4.16'% from $110'064.02 |
| Year'to'Date | Up 11.72'% from $94'419.76 |
| Volatility | Low ' 1.89'% |
Interpretation
The price sits just below a key intraday support at the 105'500 level. The market cap trend is turning bearish, and the OBV is negative, indicating that volume is flowing out of the market. The week'to'date rally is weak, while the month'to'date decline is significant. These facts suggest a short'term contraction and a likely short'term bearish bias.
Volume / Flow Profile
| Item | Detail |
|---|---|
| OBV Daily Total | '21.84 (negative flow) |
| Fair'Value Gap | $105'498.41'''$105'559.20 (virtually flat, '0.01'%) |
| Low Volatility | 1.89'% |
Interpretation
Negative OBV signals that buying pressure is weak; selling volume dominates. The fair'value gap is negligible, so the market is trading near equilibrium, which is typical before a breakout or breakdown. The low volatility further confirms a consolidation zone, ideal for a scalping or intraday trade.
Key Drivers
| Driver | Effect |
|---|---|
| Market Cap Momentum | Bearish trend below $3.642'trn ' pressure on price |
| Volume Flow | OBV negative ' sellers outnumber buyers |
| Weekly/Monthly Performance | Positive week'to'date, negative month'to'date ' mixed signals but month bias dominates |
| Price Gap | Tight gap indicates lack of momentum for a bullish move |
Interpretation
The primary driver is the bearish market'cap momentum coupled with negative volume flow. The price is currently trapped near the 105'500 level, a key resistance that, if broken down, could accelerate the downtrend.
Risk Factors
| Factor | Risk |
|---|---|
| Unexpected Positive News | Could quickly reverse the short bias |
| Liquidity Crunch | Intraday moves may be exaggerated by low liquidity |
| Large Institutional Buy | Could create a sustained uptrend |
| Regulatory Announcements | Sudden changes can cause sharp spikes |
Mitigation
Use tight stop'losses at $106'200 to protect against a brief rally. Hedge with a short'term inverse ETF if possible.
Actionable Trade Insight
Trade Type ' INTRADAY SHORT
- Entry: Target the next dip below $105'200 (a 300'point break below the 105'500 support).
- Stop'Loss: Place at $106'200 (100'point buffer).
- Take'Profit: Aim for a 50'point ('0.05'%) gain, or trail the stop to lock in profits.
- Position Size: Allocate no more than 10'% of the account to this short.
Why
The convergence of bearish market'cap momentum, negative OBV, and a tight fair'value gap creates a high probability of a short breakout. The low volatility environment makes a small'range intraday move likely.
Prediction & Confidence
- Signal: SHORT
- Confidence Score: 70 (scale 5'95, rounded to nearest 5)
Call'to'Action
The next move could happen in the next hour. Lock in the edge before the market decides.
Join Auctron's elite strategy service now and never miss a high'confidence setup again.
#BTCShortPlay #BTCIntradayEdge