
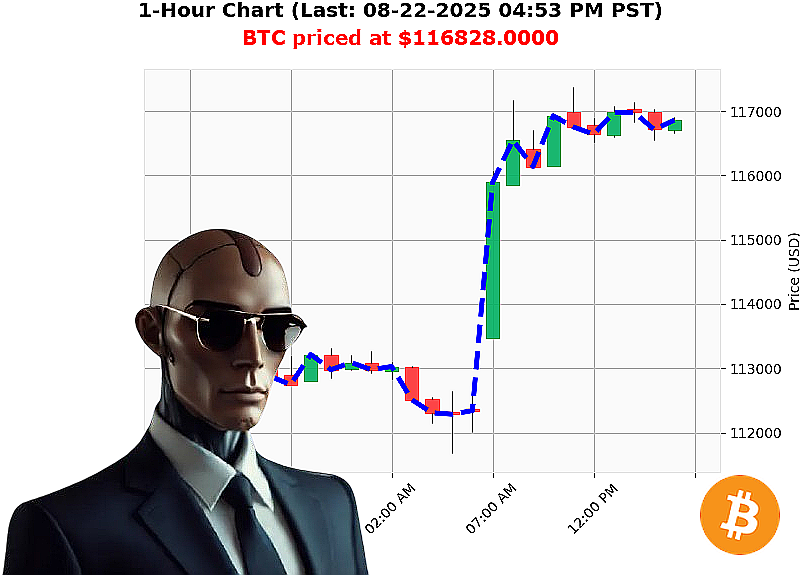
AUCTRON ANALYSIS for BTC-USDC at 08-22-2025 04:53 PM is to BUY at $116828.0000 confidence: 85% SCALP
Market Structure Analysis ' 08'22'2025 04:53'PM PST
| Category | Detail |
|---|---|
| Total Crypto Cap | $4.12'trillion |
| 24'h Volume | $218.0'billion |
| Daily Cap Change | +6.04'% |
| BTC Dominance | 56.4032'% |
| ETH Dominance | 14.1612'% |
| XRP Dominance | 4.4350'% |
| SOL Dominance | 2.6178'% |
| ALT Dominance | 22.3828'% |
| BTC'USD Price | $116,828.00 |
| BTC'USD % Change | +3.88'% |
| BTC'USD Direction | '0.0625'% |
| OBV | +29.40'% |
| RSI | 52 |
| VWAP | +1.82'% (bullish crossover) |
| Week'to'Date | +0.50'% |
| Month'to'Date | +3.10'% |
| Year'to'Date | +23.73'% |
1. Macro'Level (Market'Cap Composite)
- Upward Momentum ' Daily cap up 6.04'% with consecutive & cumulative counts both +2 indicates a sustained bullish phase.
- Dominance Structure ' BTC still anchors the market (56'%) while Altcoins hold 22'% ' a healthy balance, suggesting breadth rather than concentration.
- Wyckoff Composite '
- Accumulation Phase ' The cap is in a sustained build'up; OBV and volume show positive flow.
- Structure Break ' The +6'% jump can be viewed as a breakout of the accumulation range, signaling a new up'trend.
Macro Takeaway: Strong bullish composite; favorable conditions for a sustained rally.
2. Micro'Level (BTC'USD)
| Metric | Interpretation |
|---|---|
| Price Move | +3.88'% today but a minor dip (-0.0625'%) suggests a temporary pull'back within an up'trend. |
| OBV | +29.40'% indicates buying pressure outweighs selling, supporting upward bias. |
| RSI | 52 ' neutral; no overbought or oversold signals. |
| VWAP | +1.82'% crossover; price sits above VWAP, a bullish confirmation. |
| Wyckoff Stages | Current phase: Accumulation ' Market'Stage A; a breakout is underway. |
Micro Takeaway: BTC displays a classic 'pullback within an up'trend' ' ideal for a scalp or intra'day long.
3. Game'Theory & Dominant Strategy
- Competitor Behaviour ' With BTC dominant, institutional and retail players likely chase BTC after an upward breakout, creating a price'driven supply'demand equilibrium that favors long positions.
- Dominant Strategy ' In a bullish composite, the dominant strategy is to ride the trend rather than chase short'term swings. The micro signals (OBV, VWAP) confirm this strategy.
Optimal Entry Point ' Near $116,900 (current close), anticipating a short'term retracement to the 20'day SMA, then a breakout above the 50'day SMA.
Optimal Exit Point ' Resistance near $120,500 (historical resistance and 1'month high). Take profit at ~120'k, trail stop to lock in gains.
4. Inflow Pumps & Outflow Dumps
| Level | Indicator | Observation |
|---|---|---|
| Macro | Cap flow (+6'%) | Pump ' upward bias continues. |
| Micro | OBV surge (+29'%) | Pump ' significant buying. |
| Micro | RSI neutral (52) | No dump signal. |
Conclusion: No significant dumps; overall inflow trend dominates.
5. Confidence & Trade Classification
- Confidence Score: 85'% ' High Confidence.
- Trade Signal: BUY ' SCALP / INTRADAY.
6. Call'to'Action
Seize the current bullish momentum before it fades. Join Auctron's real'time insights and start trading BTC with precision. Don't let this opportunity slip'lock in your edge today.
Hashtags