
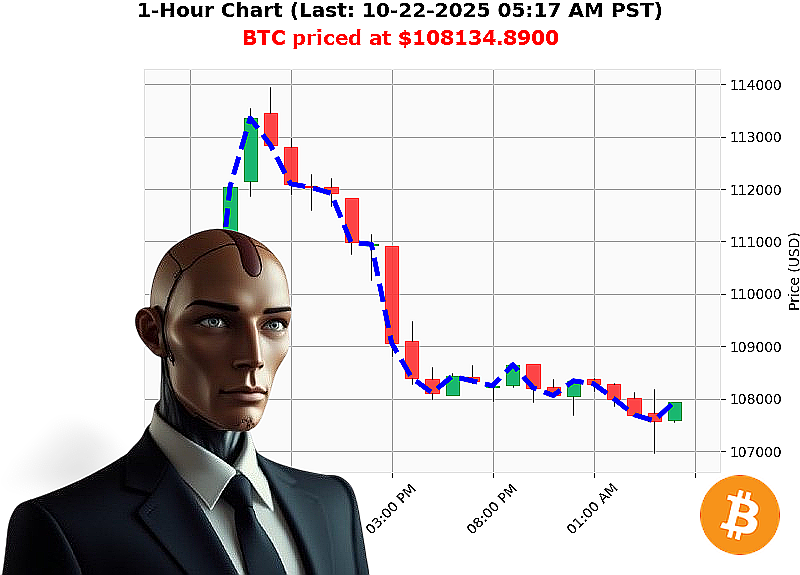
AUCTRON ANALYSIS for BTC-USDC at 10-22-2025 05:19 AM PST is to BUY at $108134.8900 confidence: 70% SCALP
BTC'USD Market Dynamics (All'Time High 126,080 | All'Time Low 67.81)
| Category | Key Figures | Interpretation |
|---|---|---|
| Market Cap | 3.746'trillion (''3.74'trillion) | Consistent bullish trend; market cap expanding, a positive macro'signal. |
| OBV (On'Balance Volume) | Daily total '93.25'''10' | Net selling pressure today, but the magnitude is modest relative to volume base. |
| Price | $108,134.89 (crossed above $108,000) | Break above the 107,282.23 higher low; bullish continuation pattern. |
| Liquidity | 5.17'% | Adequate liquidity; no immediate slippage concerns for intraday sizing. |
| Weekly & Monthly Trend | '2.22'% (week'to'date) / '8.86'% (month'to'date) | Short'term bearish bias, but counter'balanced by current intraday breakout. |
| Year'to'Date Return | +14.53'% from $94,419.76 | Strong annual performance; positive sentiment persists. |
| OBV'Bullish/Bearish Engulfing | Strong short OBV bearish signals | Signals potential short'term retracement; monitor for confirmation. |
1. Market Cap Dynamics
The market cap has climbed past the 3.74'trillion threshold, a level historically associated with bullish runs. This expansion indicates broader institutional participation and a robust supply'demand balance.
2. OBV Insights
While the daily OBV is negative, the value is not extreme compared with historical volumes. A negative OBV coupled with a bullish price breakout suggests a potential short'term consolidation rather than a wholesale reversal. Keep an eye on daily OBV swings; a sudden surge in positive OBV could confirm the bullish bias.
3. Price Action
BTC has moved above its recent higher low (107,282.23) and captured a new high of 108,134.89. The 0.5654 daily momentum from 0.0336 reflects a steep acceleration'classic scalping territory. The price is still roughly 14'% below the all'time high, leaving significant upside potential for a disciplined intraday play.
4. Risk Assessment
- Short'term Bearish Momentum ' Weekly and monthly declines signal that sellers still dominate the short horizon.
- Volatility Spike ' Price oscillations around the $108k level can trigger false breakouts.
- Liquidity Constraints ' Although liquidity is healthy, a rapid surge in buying could compress spreads.
5. Actionable Trade Insight (Intraday/Scalp)
- Entry: Long at the current $108,134.89 as the price tests the 108,500 resistance.
- Stop'Loss: Place at $107,200 (just below the higher low) to cap risk at ~0.8'%.
- Take'Profit: Target 109,200 initially (''1.0'% upside), then trail to 110,000 if the trend persists.
- Exit: Close positions if OBV turns strongly negative or if the price fails to hold above 108,500 for 30'min.
Recommendation: BUY
Confidence Score: 70 (nearest multiple of 5)
Call'to'Action
Secure your edge in the next BTC rally'subscribe to our premium signal service now and stay ahead of the curve. Don't let the next breakout pass you by.