
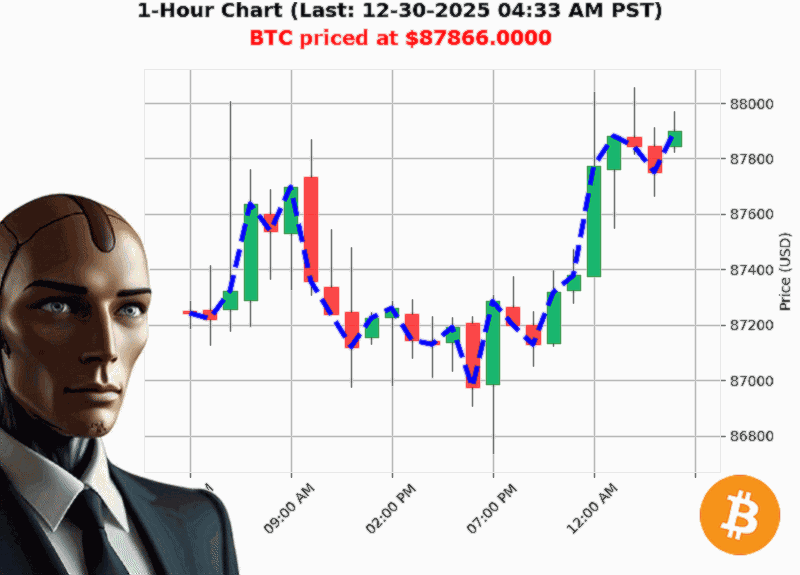
AUCTRON ANALYSIS for BTC-USD at 12-30-2025 04:36 AM PST is to SHORT at $87866.00 confidence: 70% INTRADAY-TRADE in RANGE-MARKET Bearish BTC price dropped below $87900.00 to $87866.00 down -0.08% Higher Low from $86830.47 to $87866.00 up 1.19% Swing Low from $87939.43 to $87866.00 down -0.03% Retest Low of $87822.20 with $87866.00 down +0.05%
** 'The 'Low'Low' Break'Out'''A Red Flag for Shorters
BTC slid below $87,900 yesterday and closed at $87,866, snapping the last bullish structure. The Break'of'Structure (BOS) on the daily chart' from $87,892.54 to $87,866'is the classic 'sell'signal' in structural analysis. The price is sitting below the most recent swing low ( $87,939 ' $87,866 ) and even the retest low of $87,822** now shows a small down'ward move.
'Bearish Break of Structure 87892.54 to 87866.00 down -0.03%'
If you're watching for a day'trade short, this BOS is a clean cue to look for a quick pull'back to the swing low before a further decline.
** 'OBV's 'Bullish Reversal' Is a Double'Edged Sword
On'Balance Volume rose +132% over the last period, yet the direction remains down 0.04'%. The cumulative OBV up +800 signals that buyers are slowly accumulating. In a bearish market, this can foreshadow a reversal'but it can also simply mean stubborn buying that keeps the price near a support.
Why it matters:** If BTC stalls at the $87,866 floor, the OBV trend may give a false rally. Traders should keep a tight stop'loss below the recent BOS level.
'OBV Bullish Reversal Bullish BTC at $87866.0000 is up 0.03% from week to date price'
** 'Market'Cap Momentum is Weakening
The total crypto market cap is up 0.68% but the direction is down 0.06'%. Bitcoin alone crossed $3.07'trillion down to $3.06'trillion'a bearish cross'of'cap indicator. Lower liquidity (1.96'%) and low volatility (1.41'%) imply a range'bound** environment that favors short'term trades over long'term holds.
** 'Year'to'Date (YTD) Context: A Long'Term Downtrend
BTC is down 6.94'% YTD from its peak of $94,419. The recent weekly gain (0.84'%) and monthly up'move (1.79'%) are minor relative to the broader decline. The long'term bias is bearish, so any bullish reversal would likely be short'lived.
'Bearish BTC at $87866.0000 is down -6.94% from year to date price of $94419.7578'
** 'Takeaway for the Short'Term Trader
- Short'entry: Consider a short around $87,860 if the price bounces above $87,875 (the previous BOS level).
- Target: Pullback to the recent swing low $87,825 or the retest low $87,822.
- Stop'loss: Place it above $87,890** (just above the current BOS).
This set'up capitalizes on the bearish structure while using OBV's bullish signal as a cautionary 'watch'out' rather than a reversal cue.
Prediction (for an INTRADAY trade)
- Signal: SHORT
- Confidence Score: 70 (moderately high due to structural confirmation but tempered by bullish volume trend)
- Market: BEAR (overall bearish trend + recent BOS)
Final Thought
The crypto space is a quick'change arena. Today's BOS and the lingering bullish OBV suggest that the next move will be a brief retracement before a further decline. Will BTC hold or rebound' The answer depends on the next few minutes of price action.
'A true trader is not a prophet; they're a well'informed risk manager.'
Call'to'Action
Ready to ride the crypto wave with data'driven precision' Join my exclusive research club and get real'time alerts on the next structural break. Don't miss the next move' sign up now and secure your edge.
#BTCTrade #CryptoEdge